Fig. 2.
Download original image
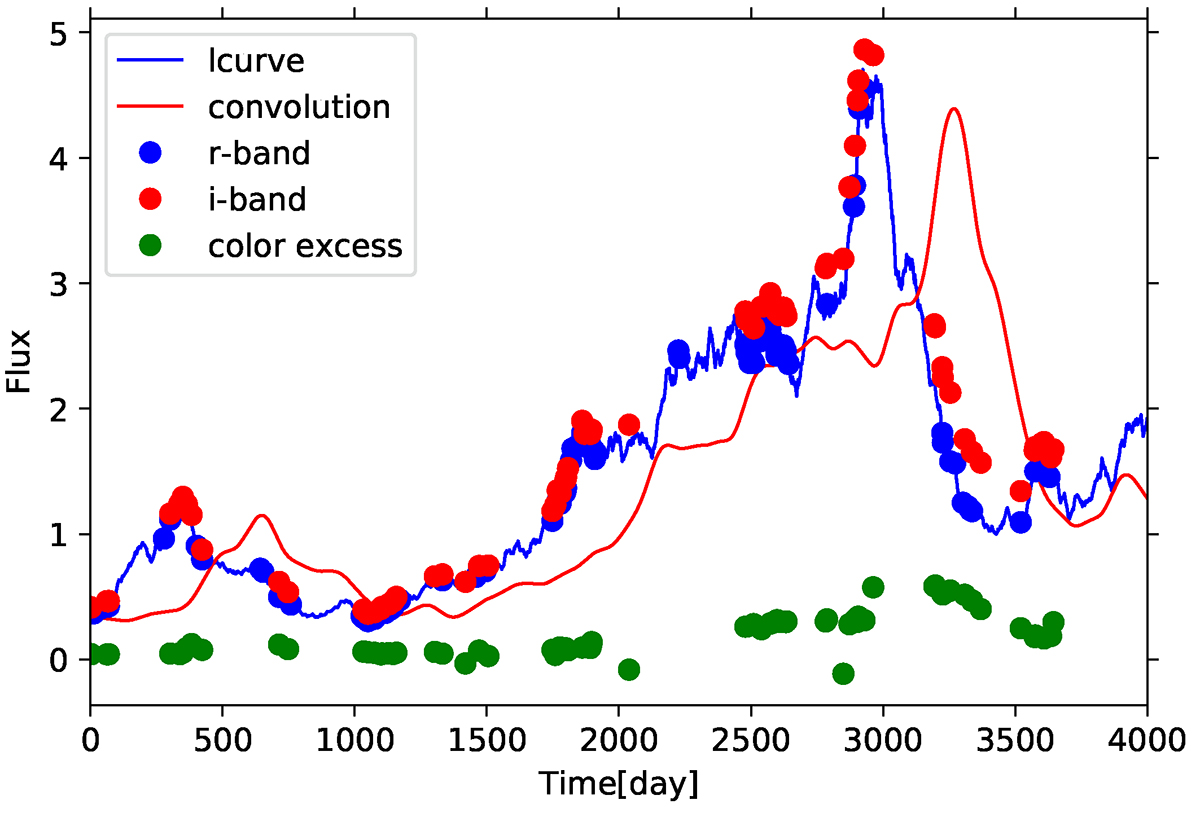
Example of the artificial dense light curve (continuous blue line), its convolution with the BLR response (continuous red line), observational points in i band set by the cadence (red circles), and observational points in r set by the cadence, with contamination from the CIV line (blue circles). Green points represent the net contamination for ϵi = 1.0 (see Eq. (2)). The delay is calculated between the green and blue points. We adopt standard values of the parameters from Table 2 and z = 2.7.
Current usage metrics show cumulative count of Article Views (full-text article views including HTML views, PDF and ePub downloads, according to the available data) and Abstracts Views on Vision4Press platform.
Data correspond to usage on the plateform after 2015. The current usage metrics is available 48-96 hours after online publication and is updated daily on week days.
Initial download of the metrics may take a while.