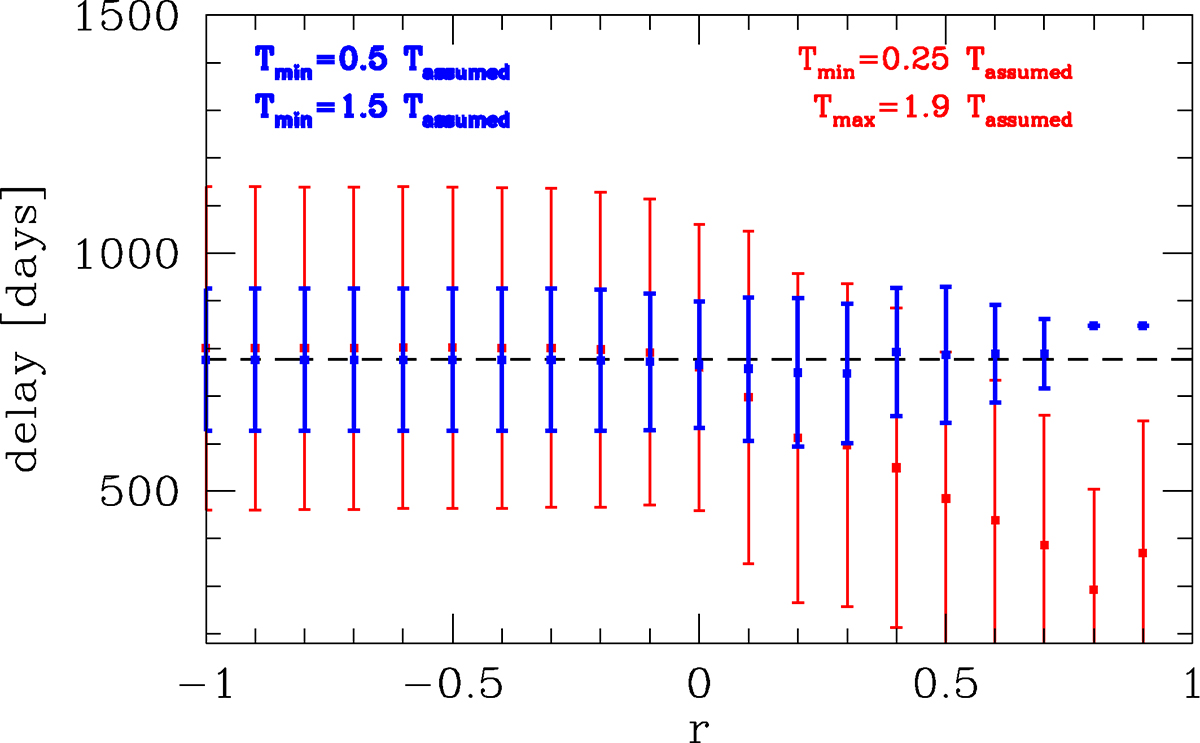
Fig. A.5.
Download original image
Time delay from the subsample of 1000 simulations selected according to the minimum value of r (simulations with the maximum value of the correlation coefficient smaller than r were removed from the sample) and the adopted limits for time delay. Narrower limits clearly give smaller errors, which is reflected in the dispersion.
Current usage metrics show cumulative count of Article Views (full-text article views including HTML views, PDF and ePub downloads, according to the available data) and Abstracts Views on Vision4Press platform.
Data correspond to usage on the plateform after 2015. The current usage metrics is available 48-96 hours after online publication and is updated daily on week days.
Initial download of the metrics may take a while.