Open Access
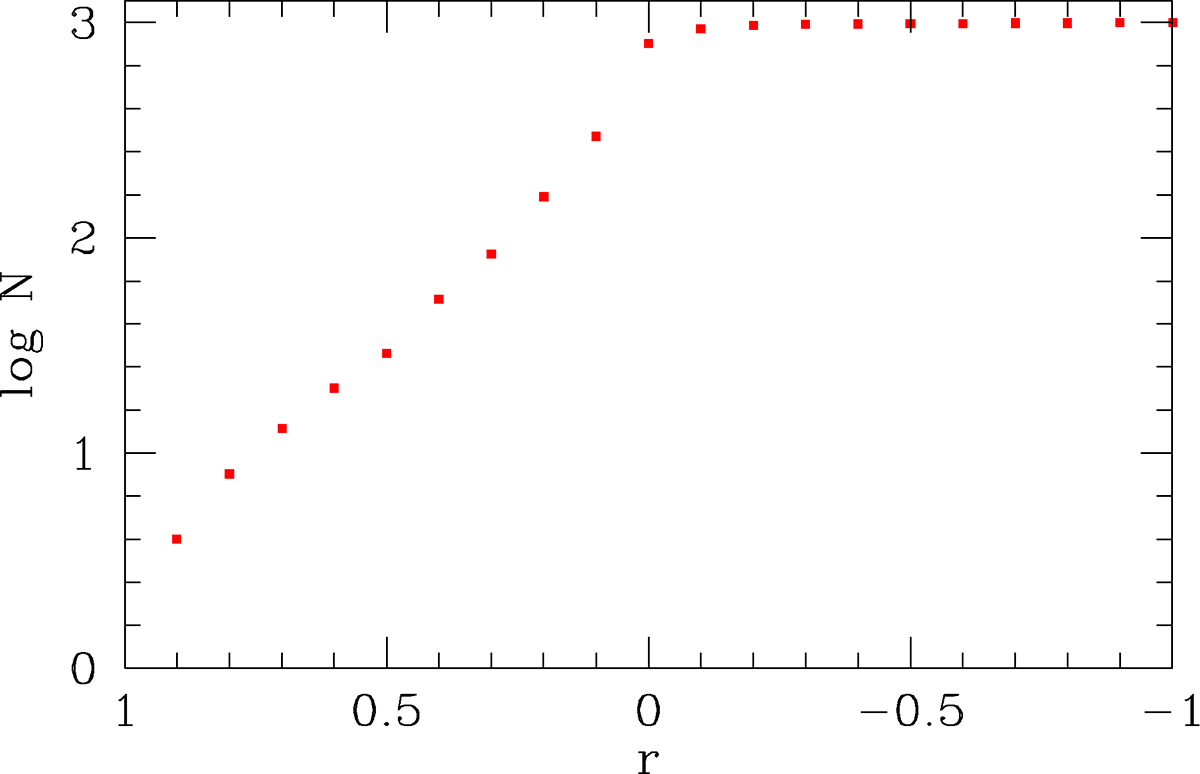
Fig. A.3.
Download original image
Number of curve pairs left out of 1000 simulated pairs as a function of the adopted cutoff for the correlation coefficient r. Only 84 pairs out of 1000 have r > 0.3.
Current usage metrics show cumulative count of Article Views (full-text article views including HTML views, PDF and ePub downloads, according to the available data) and Abstracts Views on Vision4Press platform.
Data correspond to usage on the plateform after 2015. The current usage metrics is available 48-96 hours after online publication and is updated daily on week days.
Initial download of the metrics may take a while.