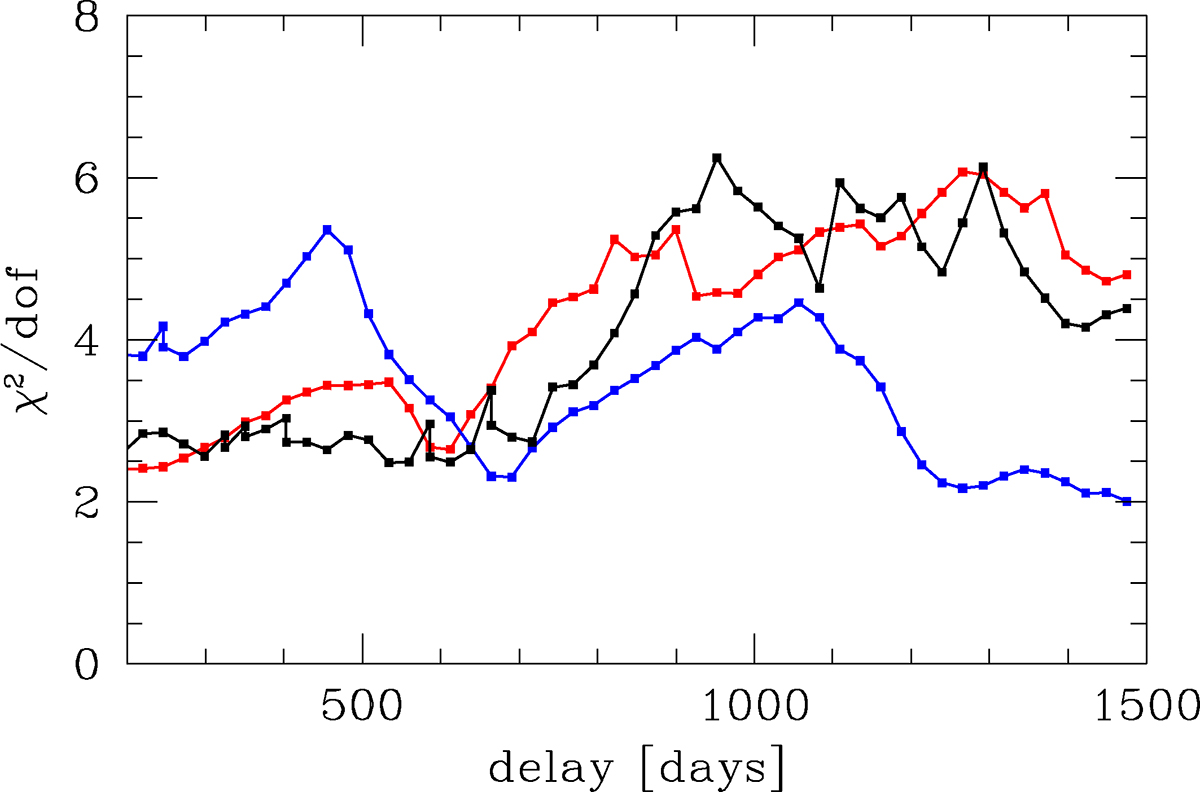
Fig. A.2.
Download original image
χ2 distribution as the function of the assumed time delay for three exemplary light curves showing the best-fit time delay of 533 days (black line), 1475 days (maximum allowed; blue line), and 194 days (minimum allowed, red line). They all show a minimum around ∼700 days, but this is only a local minimum. The assumed time delay is 776.27 days.
Current usage metrics show cumulative count of Article Views (full-text article views including HTML views, PDF and ePub downloads, according to the available data) and Abstracts Views on Vision4Press platform.
Data correspond to usage on the plateform after 2015. The current usage metrics is available 48-96 hours after online publication and is updated daily on week days.
Initial download of the metrics may take a while.