Open Access
Fig. A.1.
Download original image
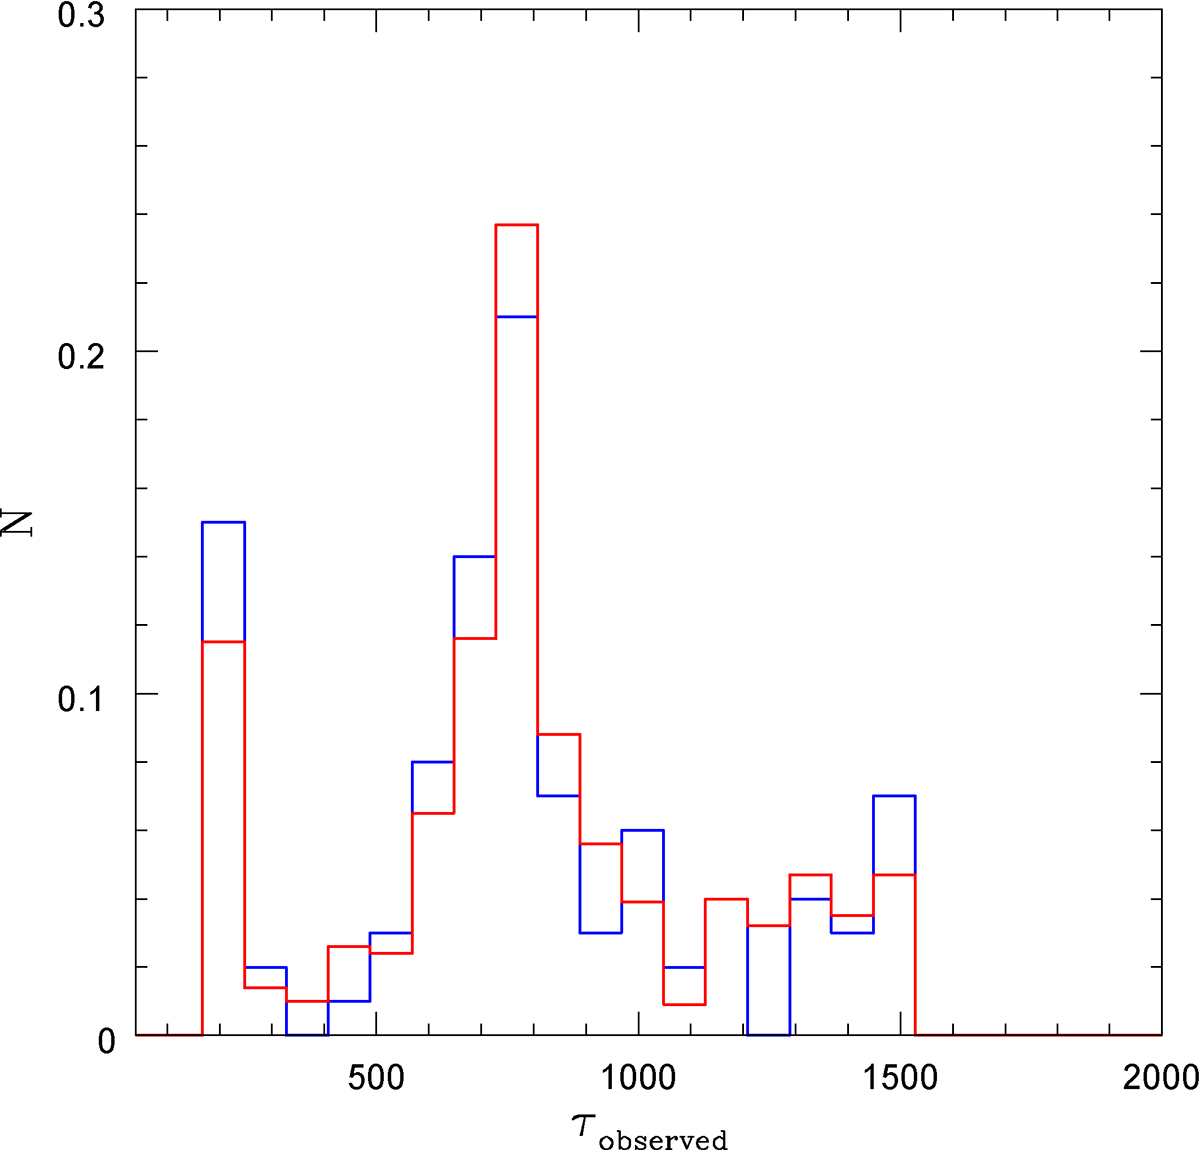
Example of the histogram of the 100 random realizations for the time delay (blue histogram), and 1000 realizations of the same process (red histogram). The assumed redshift is 1.93, and the assumed luminosity is log L3000 = 45.7, L3000 in erg s−1,. The expected time delay is 776.27 days.
Current usage metrics show cumulative count of Article Views (full-text article views including HTML views, PDF and ePub downloads, according to the available data) and Abstracts Views on Vision4Press platform.
Data correspond to usage on the plateform after 2015. The current usage metrics is available 48-96 hours after online publication and is updated daily on week days.
Initial download of the metrics may take a while.