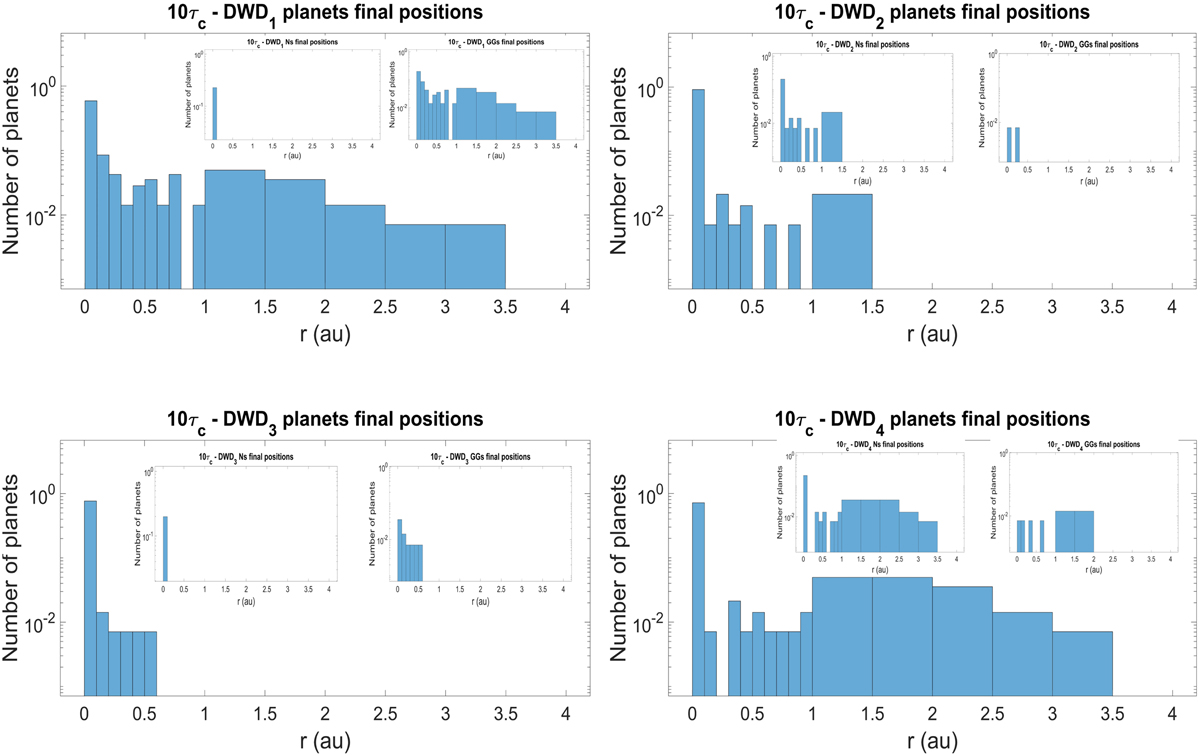
Fig. 9
Download original image
Distributions of final positions of planets formed at t0 = 10τc by the DWD systems adopted in this work. All the histograms have Y-axis in log scale and each bin is normalised with respect to the total number of planets formed by each system. The largest histograms show the distribution of the final positions of all the planets for each DWD system. Each of these histograms has two smaller overlapping histograms showing the final positions of Ns and GGs. When t0 = 0.1, 1 Myr, all planets (which consists only of SNs and Ns) migrate towards the inner radius of the disc, rin (see Appendix A). Therefore, the related histograms would only show one bin around the rin value of the discs.
Current usage metrics show cumulative count of Article Views (full-text article views including HTML views, PDF and ePub downloads, according to the available data) and Abstracts Views on Vision4Press platform.
Data correspond to usage on the plateform after 2015. The current usage metrics is available 48-96 hours after online publication and is updated daily on week days.
Initial download of the metrics may take a while.