Fig. 8
Download original image
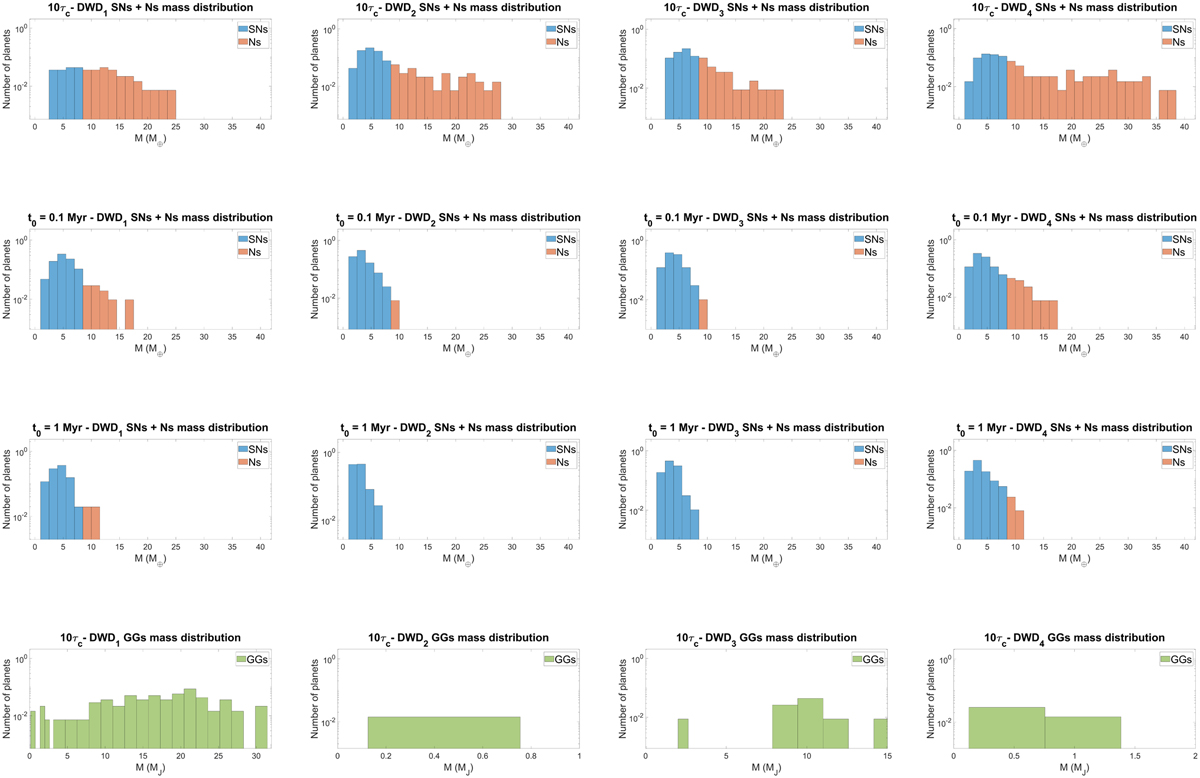
Mass distribution of the planets formed by the DWD systems analysed in this work. All histograms are normalised with respect to the total number of planets formed in each case, and the Y-axis are plotted in log scale. From left to right, the histograms show the mass distribution for each DWD system. From top to bottom, the first three rows of histograms show the distribution as a function of the values of t0 adopted for our simulations (i.e. 10τc, 0.1 Myr, and 1 Myr, respectively). These histograms show only the mass distribution of SNs (blue bins) and Ns (red bins). The histograms in the bottom row show only the distributions of GGs for each system at t0 = 10τc as GGs only form in this case.
Current usage metrics show cumulative count of Article Views (full-text article views including HTML views, PDF and ePub downloads, according to the available data) and Abstracts Views on Vision4Press platform.
Data correspond to usage on the plateform after 2015. The current usage metrics is available 48-96 hours after online publication and is updated daily on week days.
Initial download of the metrics may take a while.