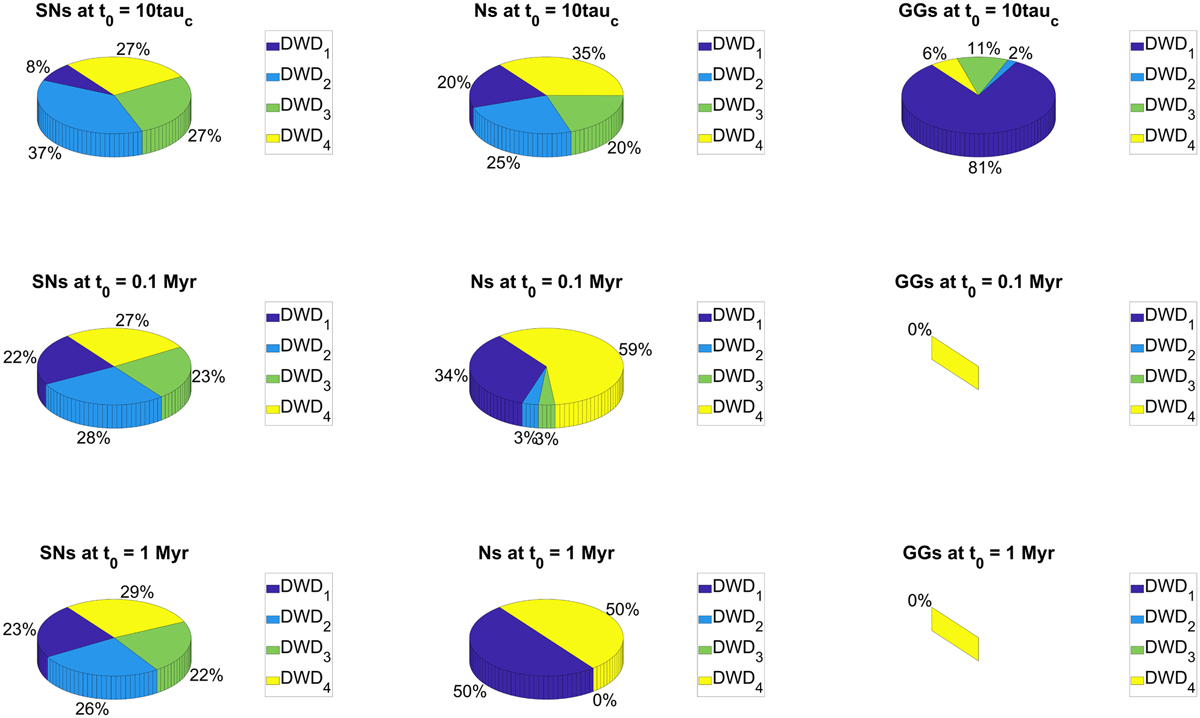
Fig. 7
Download original image
Distribution of planets among DWD systems adopted in this work. From left to right, for each DWD system the pie charts show the distribution of SNs, Ns, and GGs. From top to bottom, the distribution of planets among the systems are shown at the different values of t0 adopted for our simulations: 10τc, 0.1 Myr, and 1 Myr. The bottom right and the middle right charts show that no system forms GGs when t0 = 0.1, 1 Myr (see Appendix A).
Current usage metrics show cumulative count of Article Views (full-text article views including HTML views, PDF and ePub downloads, according to the available data) and Abstracts Views on Vision4Press platform.
Data correspond to usage on the plateform after 2015. The current usage metrics is available 48-96 hours after online publication and is updated daily on week days.
Initial download of the metrics may take a while.