Fig. 4
Download original image
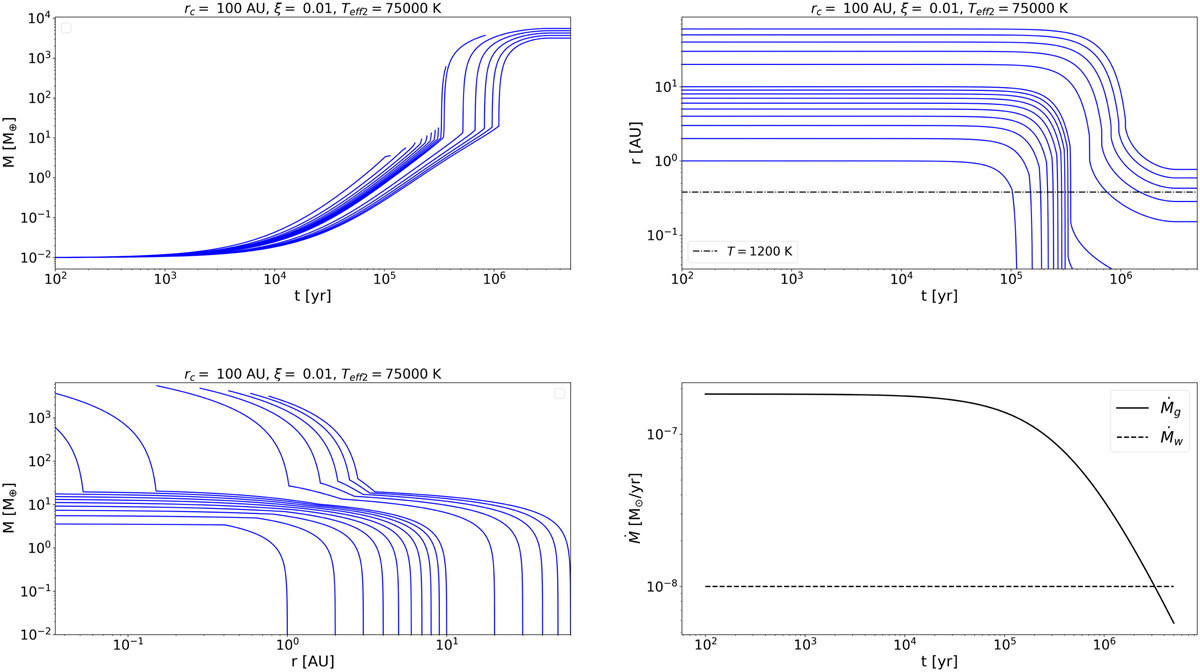
Time-dependent growth tracks (top left) and orbital tracks (top right) for the disc model with rc, ξ, Teff 2 indicated at the top of the panels (DWD1 system). The bottom left panel shows the same tracks as the top left and top right panels, but with the mass on the y-axis and the orbital radius on the x-axis. The bottom right panel shows the accretion rate of the disc described by the adopted parameters (Σ0 = 37.53 g cm−2). In the top right panel, the dot-dashed line corresponds to the orbital radius where T = 1200 K. The apparently vertical lines corresponds to the gas contraction phase (see Sect. 3.1.3). The fractions of track before and after the ‘vertical’ section correspond to the pebble accretion and the runaway gas accretion phase, respectively.
Current usage metrics show cumulative count of Article Views (full-text article views including HTML views, PDF and ePub downloads, according to the available data) and Abstracts Views on Vision4Press platform.
Data correspond to usage on the plateform after 2015. The current usage metrics is available 48-96 hours after online publication and is updated daily on week days.
Initial download of the metrics may take a while.