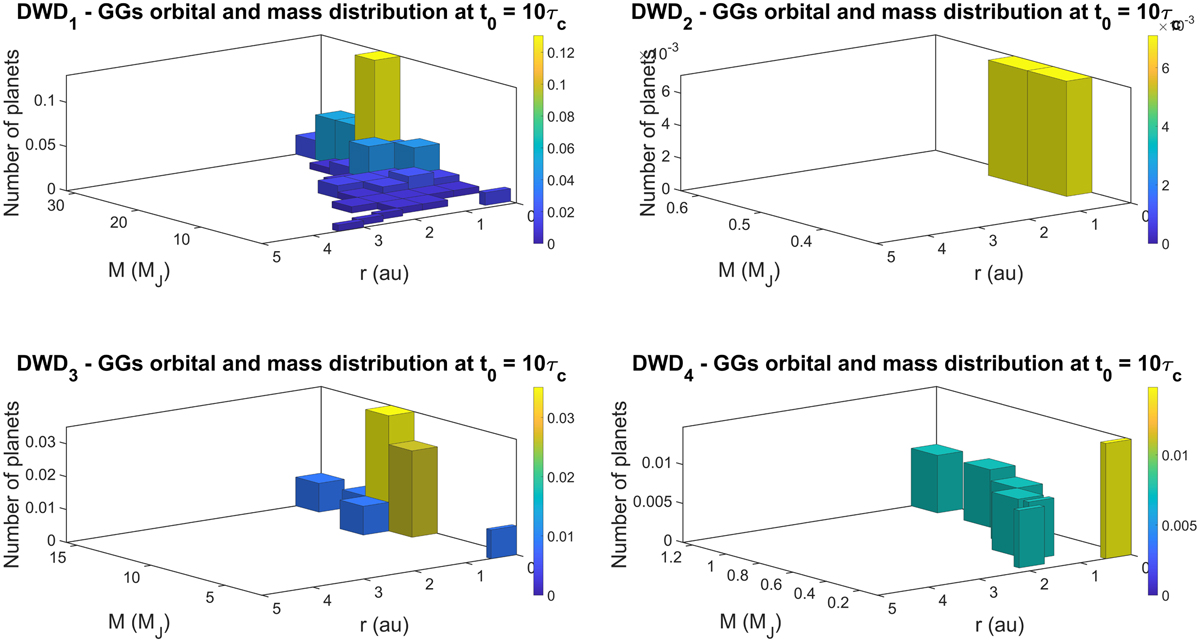
Fig. 11
Download original image
Distributions of mass and final position of the GGs formed at t0 = 10τc by each system analysed in this work. The X-axis and the Y-axis of each of the 3D histograms show the radial position and the mass of the planets, respectively. The X-axis values increase from right to left. The number of planets in each 3D bin is normalised with respect to the total number of planets formed by each system. Following the vertical colour bar on the right of each histogram, the pale yellow bins include the largest amount of GGs, and the dark-blue bins include the smallest amount of GGs.
Current usage metrics show cumulative count of Article Views (full-text article views including HTML views, PDF and ePub downloads, according to the available data) and Abstracts Views on Vision4Press platform.
Data correspond to usage on the plateform after 2015. The current usage metrics is available 48-96 hours after online publication and is updated daily on week days.
Initial download of the metrics may take a while.