Fig. 10
Download original image
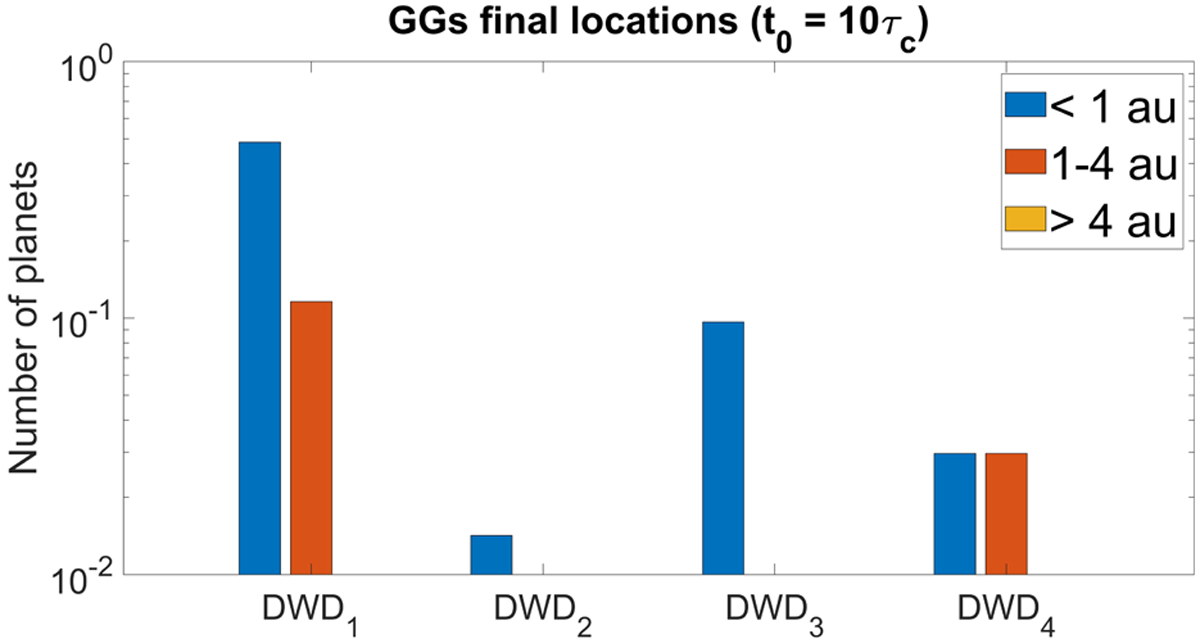
Final position distribution of the GGs formed at t0 = 10τc by each DWD system analysed in this work. Each bar is normalised with respect to the total number of planets formed by each DWD system, and the Y-axis is in log scale. The final positions are distributed among the radial intervals rin − 1 au (blue bars), 1–4 au (orange bars), and 4 au − rc (yellow bars) (see Appendix A).
Current usage metrics show cumulative count of Article Views (full-text article views including HTML views, PDF and ePub downloads, according to the available data) and Abstracts Views on Vision4Press platform.
Data correspond to usage on the plateform after 2015. The current usage metrics is available 48-96 hours after online publication and is updated daily on week days.
Initial download of the metrics may take a while.