Fig. 8.
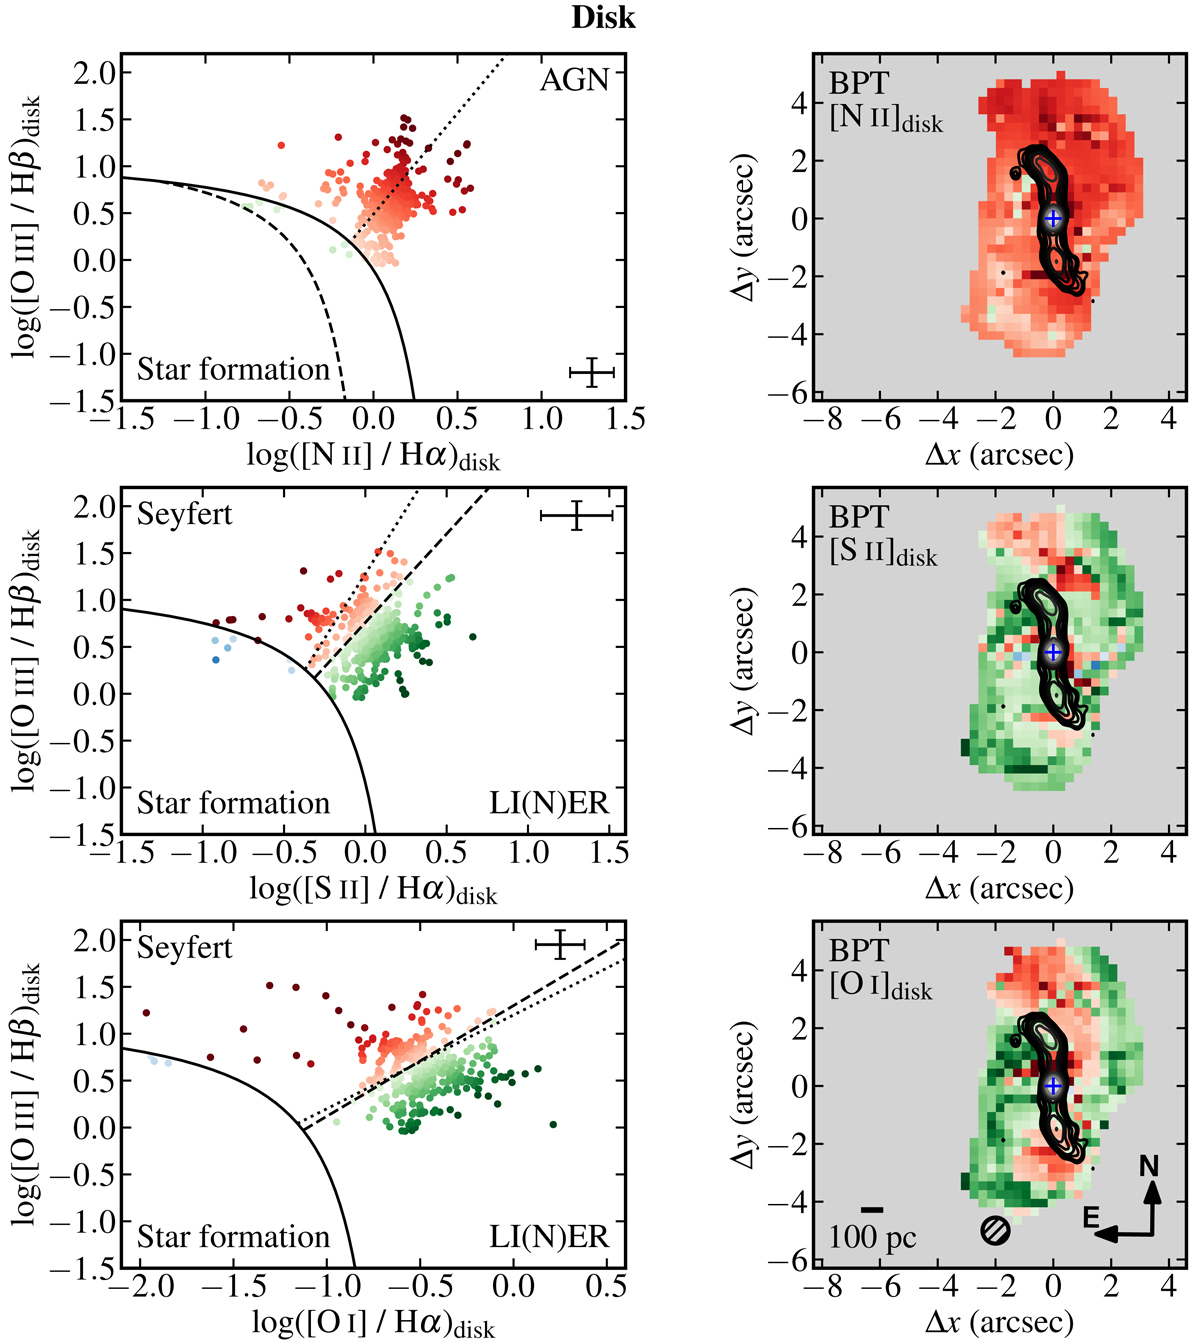
Download original image
Spatially resolved BPT diagnostic diagrams (left panels) and maps (right panels) for the disk component. The top, middle, and bottom diagrams of the left panels correspond to [O III]λ5007/Hβ versus [N II]λ6583/Hα, ([S II]λ6716 + λ6731)/Hα, and [O I]λ6300/Hα, respectively. The points in the red color scale are spaxels in the AGN or Seyfert region, those in the blue color scale are spaxels in the star-forming region, and those in the green color scale in the composite-like or LI(N)ER region. Solid curves are theoretical upper limits of starburst models from Kewley et al. (2001). The dashed curve in the [N II] diagram is the demarcation between starburst galaxies and AGN proposed by Kauffmann et al. (2003). Dashed lines in the [S II] and [O I] diagrams are classification lines proposed by Kewley et al. (2006) to split Seyfert and LI(N)ER emission. Dotted lines in the diagnostic diagrams mark bisector lines between the loci of points for the shock-excited NGC 1482 and the AGN-excited NGC 1365 (Sharp & Bland-Hawthorn 2010). For reference, the error bars represent the measurement uncertainties in a spaxel outside the outflow region, at ≃2.4″ north of the AGN. The right panels are diagnostic maps color coded in the same way as their corresponding diagrams to the left. Contours in the maps show the radio jet using the VLA data described in Sect. 2.2.
Current usage metrics show cumulative count of Article Views (full-text article views including HTML views, PDF and ePub downloads, according to the available data) and Abstracts Views on Vision4Press platform.
Data correspond to usage on the plateform after 2015. The current usage metrics is available 48-96 hours after online publication and is updated daily on week days.
Initial download of the metrics may take a while.