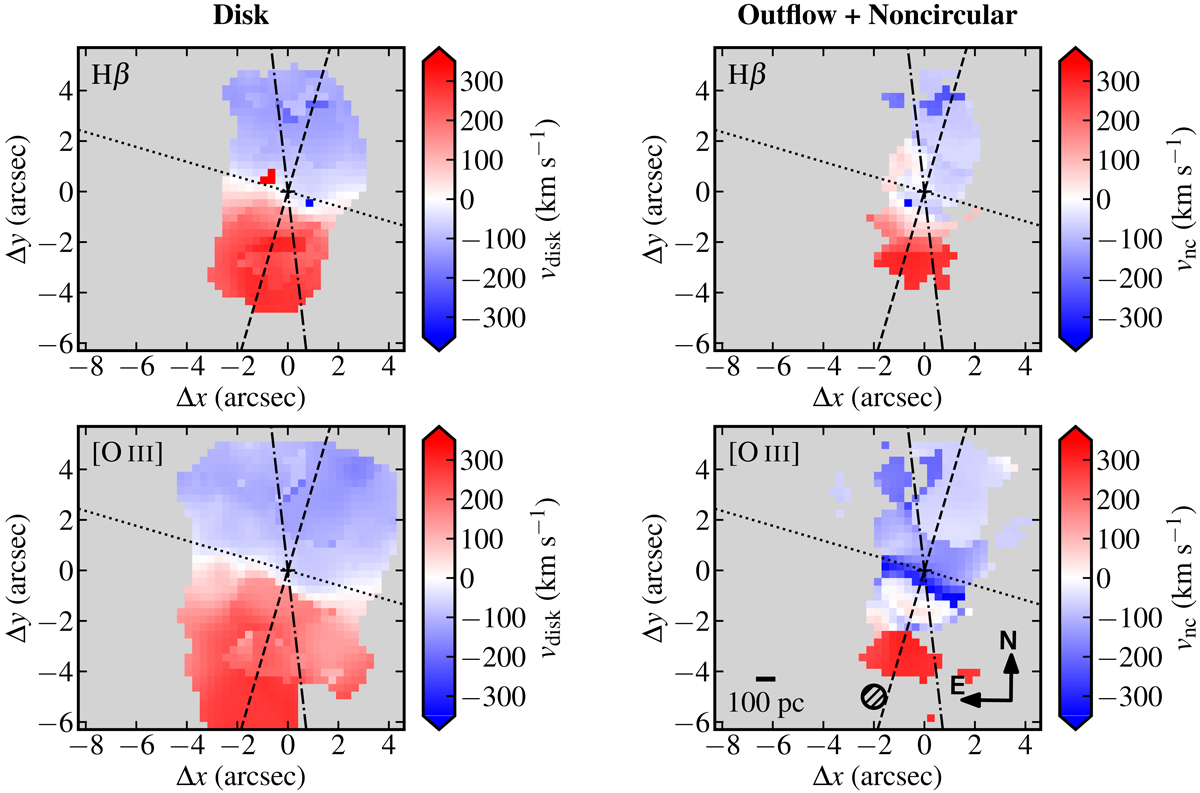
Fig. 6.
Download original image
Velocity maps of the disk (left) and the outflow+noncircular (right) components for the lines observed with the GTC/MEGARA LR-B grating, i.e., the Hβ and [O III]λλ4959, 5007 lines. Values are referred to the systemic velocity. The lines indicate the orientation of the slit PA in Fig. 4 (see text for details). Other symbols are the same as in Fig. 5.
Current usage metrics show cumulative count of Article Views (full-text article views including HTML views, PDF and ePub downloads, according to the available data) and Abstracts Views on Vision4Press platform.
Data correspond to usage on the plateform after 2015. The current usage metrics is available 48-96 hours after online publication and is updated daily on week days.
Initial download of the metrics may take a while.