Fig. 5.
Download original image
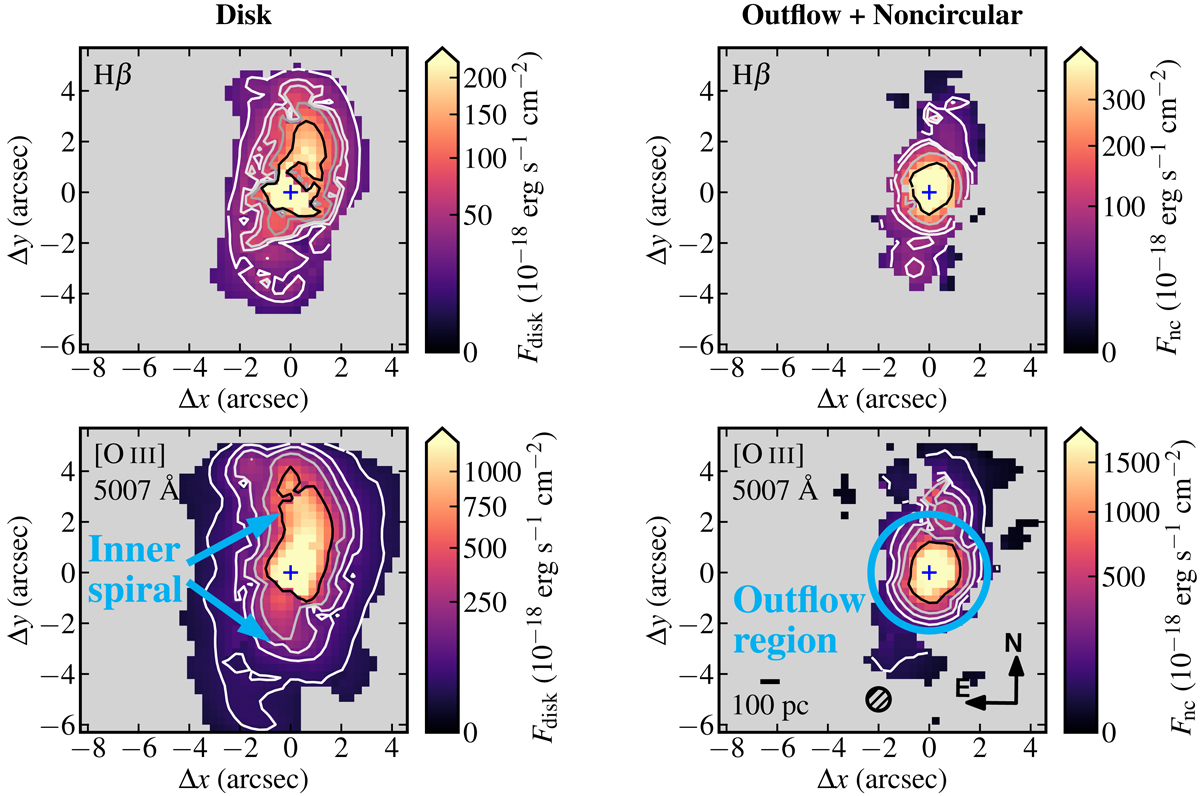
Flux maps of the disk (left) and the outflow+noncircular (right) components for the lines observed with the GTC/MEGARA LR-B grating, i.e., the Hβ and [O III]λ5007 lines. All the color bars use a square root scale and are saturated at the half maximum value of each map. Contour levels correspond to 30, 60, 70, 80, and 90 per cent of the maximum value of each map. Crosses indicate the location of the nucleus (as defined by the peak of the continuum). The northeast compass, the hatched circle indicating the seeing size, and physical size bar on the bottom-right map apply to all the maps.
Current usage metrics show cumulative count of Article Views (full-text article views including HTML views, PDF and ePub downloads, according to the available data) and Abstracts Views on Vision4Press platform.
Data correspond to usage on the plateform after 2015. The current usage metrics is available 48-96 hours after online publication and is updated daily on week days.
Initial download of the metrics may take a while.