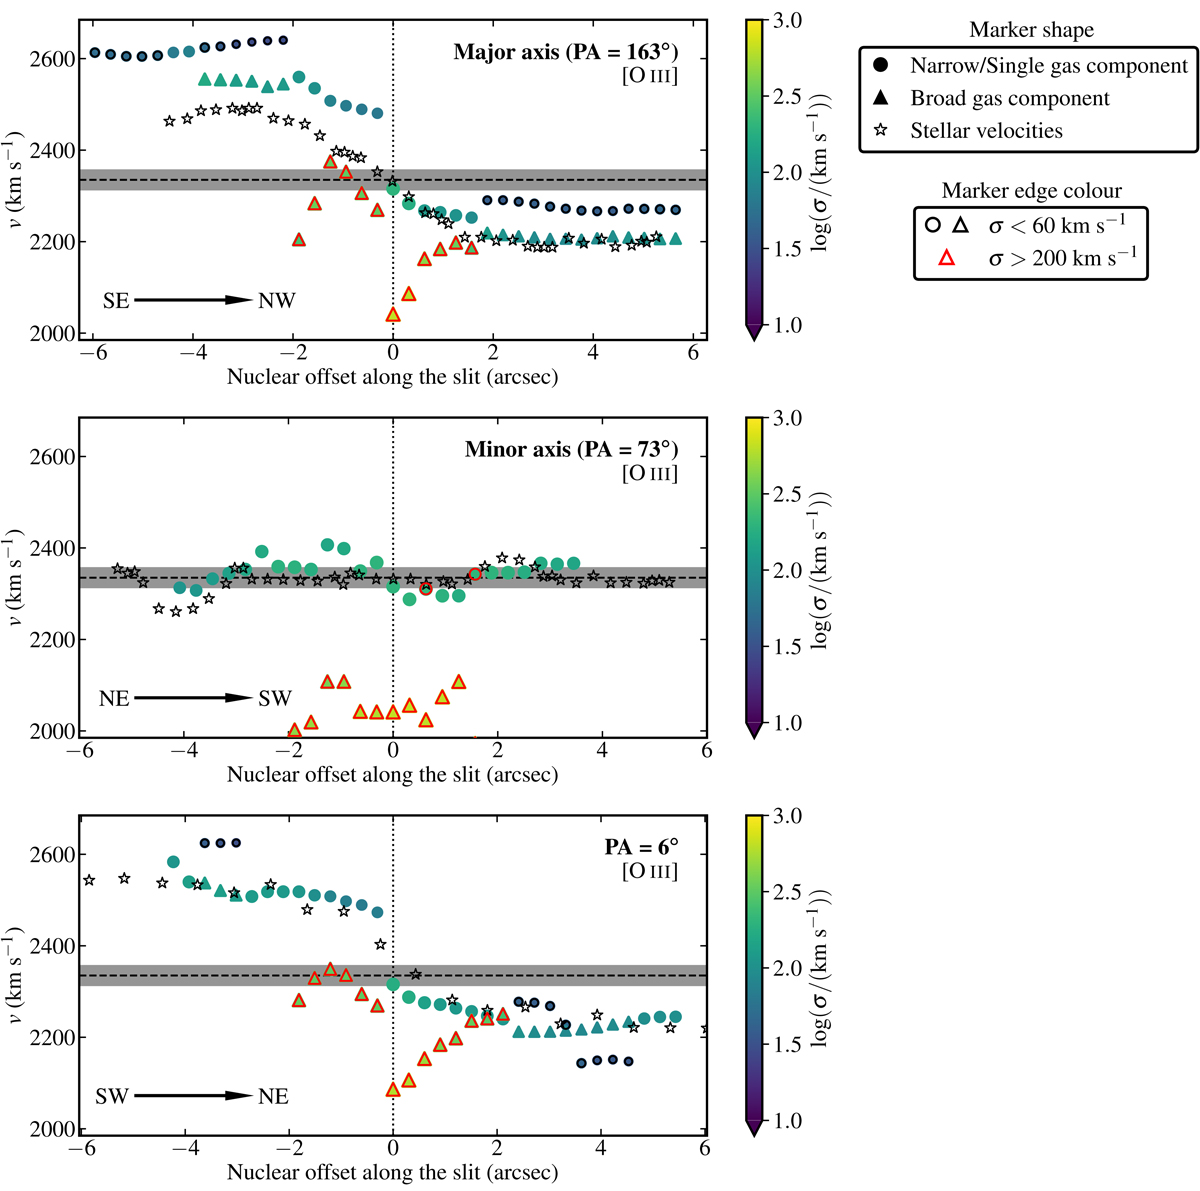
Fig. 4.
Download original image
Comparison between the velocities of the ionized gas derived from fits using a maximum of two Gaussian components for the [O III]λλ4959, 5007 doublet and the stellar velocities. From top to bottom, the stellar velocities are along the major and minor axes of the galaxy from Ferruit et al. (2004) and along PA = 6° from González Delgado et al. (2002). Circles represent the narrow component or that when only one Gaussian is required to fit the line, while triangles correspond to the broad component. Stars show stellar velocities. The color and size of the circles and triangles depend on the velocity dispersion of each component. Black and red edges have been added to the circles and triangles, respectively, for velocity dispersions below and above 60/200 km s−1 in order to illustrate the component classification explained in Sect. 3.1. The horizontal dashed line shows the systemic velocity and the horizontal gray region its error.
Current usage metrics show cumulative count of Article Views (full-text article views including HTML views, PDF and ePub downloads, according to the available data) and Abstracts Views on Vision4Press platform.
Data correspond to usage on the plateform after 2015. The current usage metrics is available 48-96 hours after online publication and is updated daily on week days.
Initial download of the metrics may take a while.