Fig. 3.
Download original image
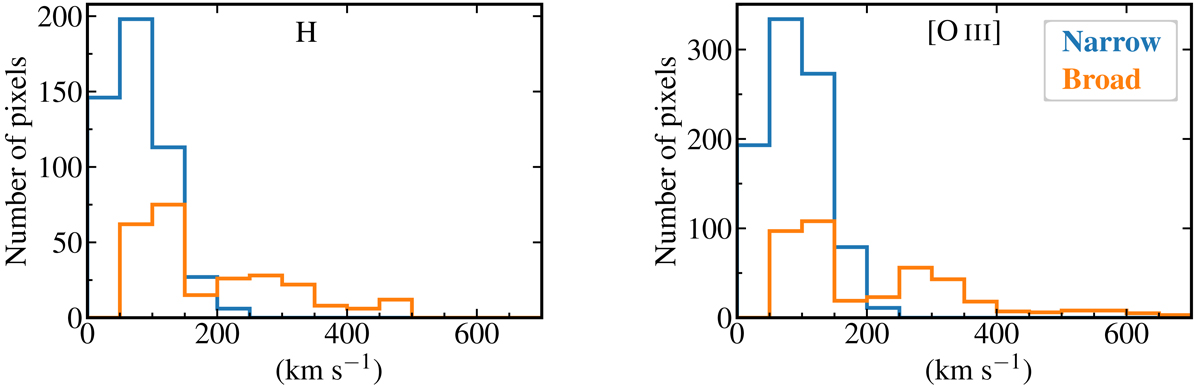
Observed distribution of the velocity dispersions (corrected for the instrumental resolution) fitted on a spaxel-by-spaxel basis and using a maximum of two Gaussian components from lines observed with the GTC/MEGARA LR-B grating, i.e., Hβ and [O III]λλ4959, 5007 lines. Blue and orange lines correspond to the narrow and broad components, respectively (see text).
Current usage metrics show cumulative count of Article Views (full-text article views including HTML views, PDF and ePub downloads, according to the available data) and Abstracts Views on Vision4Press platform.
Data correspond to usage on the plateform after 2015. The current usage metrics is available 48-96 hours after online publication and is updated daily on week days.
Initial download of the metrics may take a while.