Fig. 2.
Download original image
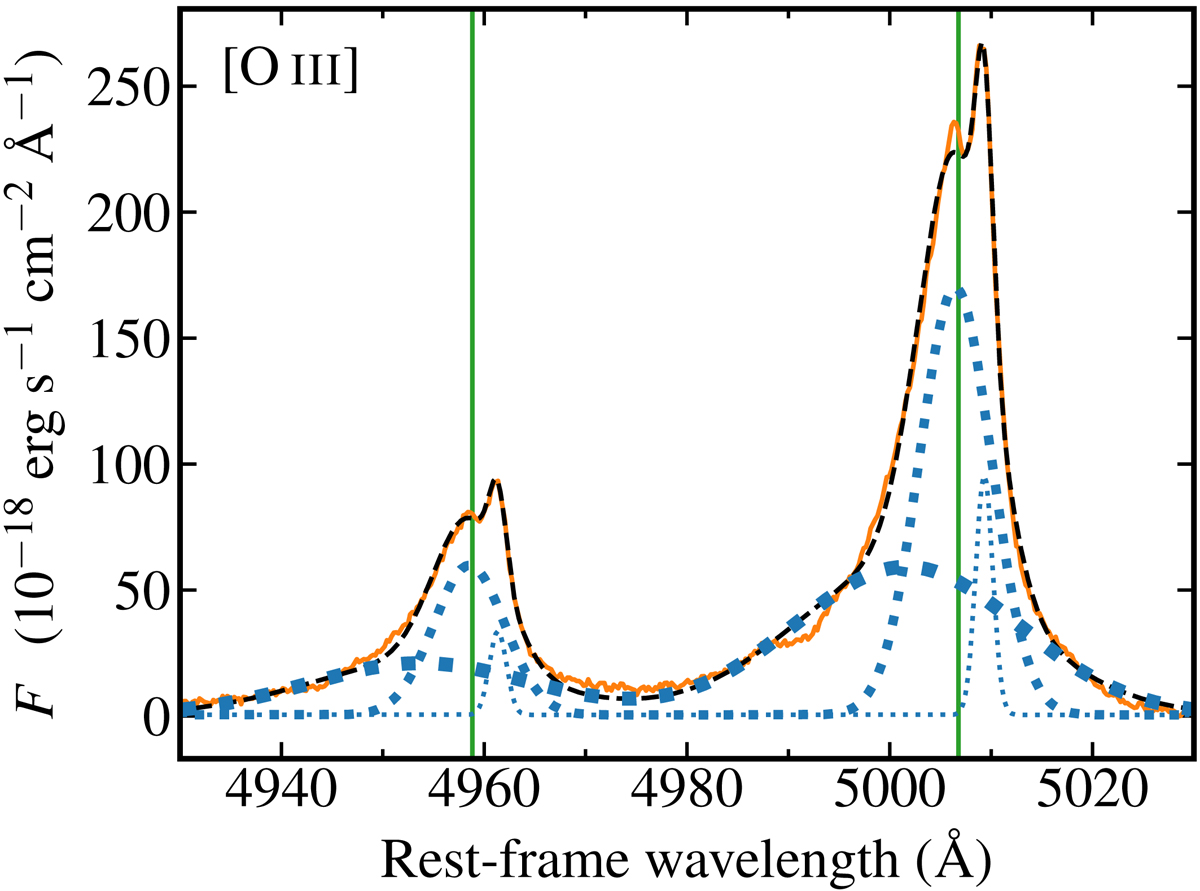
GTC/MEGARA nuclear spectrum of NGC 2110 in the spectral region around the [O III]λλ4959, 5007 doublet. The orange line is the observed spectrum after the subtraction of the continuum and extracted with a 0.9″ × 0.9″ aperture. The fit (dashed black line) is the sum of three Gaussian components. The dotted blue lines show each component of the fit, with lines of increasing thickness for the components with increasing velocity dispersions. The green lines are the line wavelengths.
Current usage metrics show cumulative count of Article Views (full-text article views including HTML views, PDF and ePub downloads, according to the available data) and Abstracts Views on Vision4Press platform.
Data correspond to usage on the plateform after 2015. The current usage metrics is available 48-96 hours after online publication and is updated daily on week days.
Initial download of the metrics may take a while.