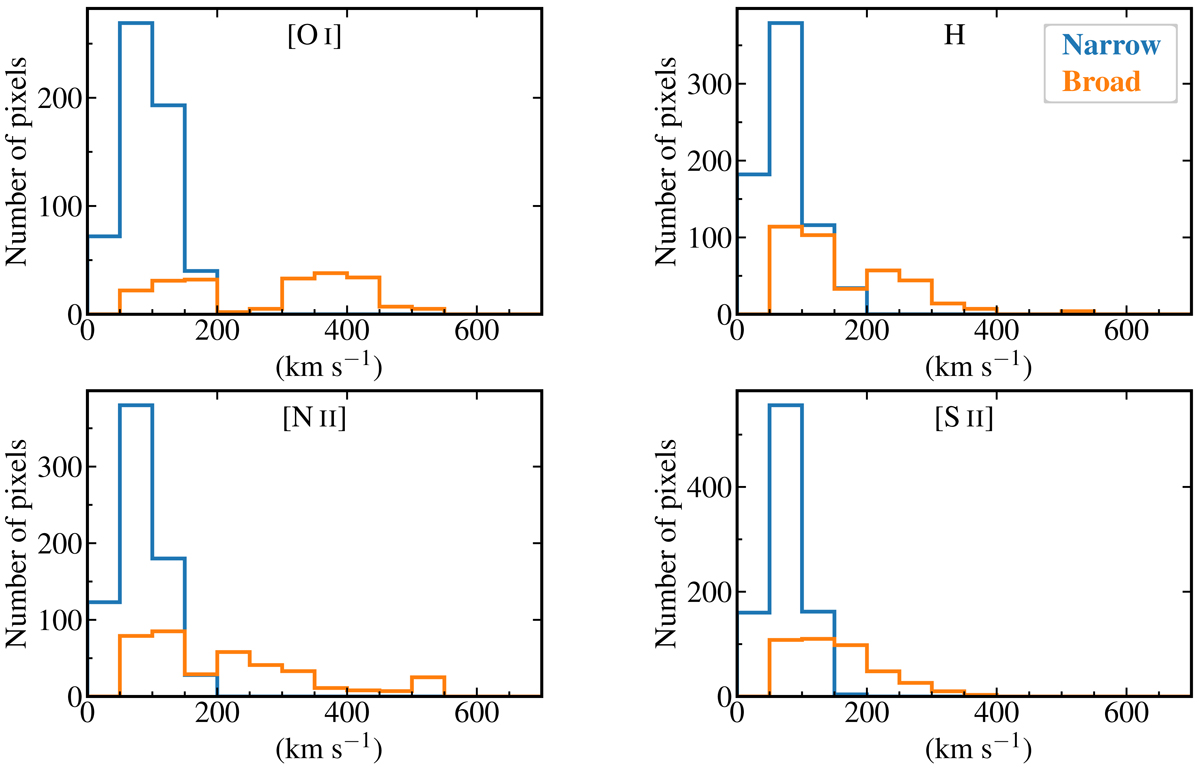
Fig. B.1.
Download original image
Distributions of the velocity dispersion (corrected for instrumental resolution) measured on a spaxel-by-spaxel basis of the fits using a maximum of two Gaussian components from lines observed with the MEGARA LR-R grating, i.e., the [O I]λ6300, Hα, [N II]λλ6548, 6583, and [S II]λλ6716, 6731 lines. Colors have the same meanings as in Fig. 3.
Current usage metrics show cumulative count of Article Views (full-text article views including HTML views, PDF and ePub downloads, according to the available data) and Abstracts Views on Vision4Press platform.
Data correspond to usage on the plateform after 2015. The current usage metrics is available 48-96 hours after online publication and is updated daily on week days.
Initial download of the metrics may take a while.