Fig. 6
Download original image
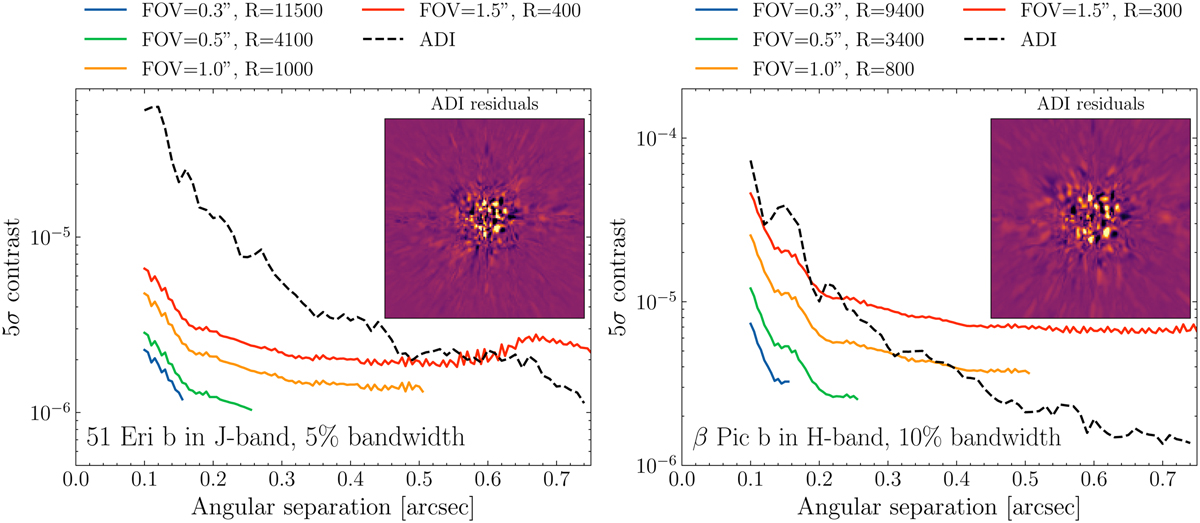
Contrast curves with molecule mapping from the simulated observations. Different lines are for different combinations of spectral resolution and FOVs, and all use the same number of detector pixels. The inset shows the residuals after applying ADI on the mock observations. Left: 51 Eri b in the J-band with a 5% spectral bandwidth. Right: β Pic b in the H-band with a 10% bandwidth.
Current usage metrics show cumulative count of Article Views (full-text article views including HTML views, PDF and ePub downloads, according to the available data) and Abstracts Views on Vision4Press platform.
Data correspond to usage on the plateform after 2015. The current usage metrics is available 48-96 hours after online publication and is updated daily on week days.
Initial download of the metrics may take a while.