Fig. 7
Download original image
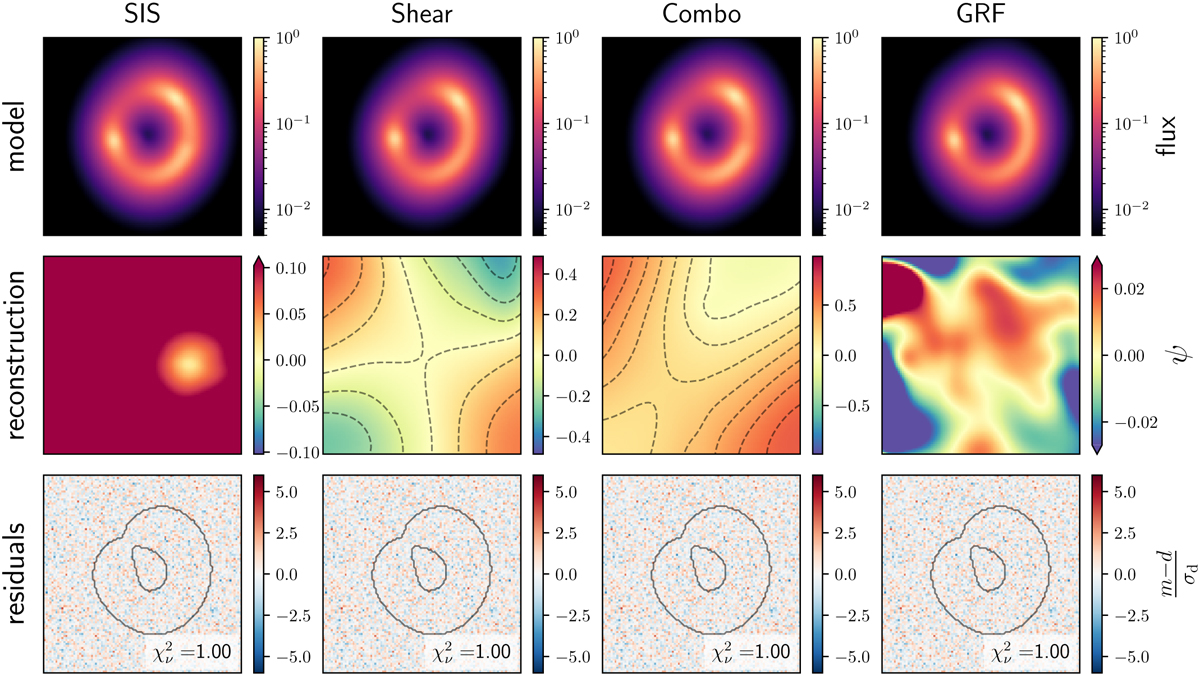
Top row: models of the mock data shown in Fig. 6. Middle row: reconstructed perturbations. Bottom: model residuals in normalized units, i.e., divided by the diagonal, σd, of the data covariance matrix from Eq. (14). We note in particular that within the area of the most significant lensed flux, as indicated by the mask (solid colour), the residual are identical to noise. The reduced chi-squared ![]() of the models is also given in the panels of the bottom row.
of the models is also given in the panels of the bottom row.
Current usage metrics show cumulative count of Article Views (full-text article views including HTML views, PDF and ePub downloads, according to the available data) and Abstracts Views on Vision4Press platform.
Data correspond to usage on the plateform after 2015. The current usage metrics is available 48-96 hours after online publication and is updated daily on week days.
Initial download of the metrics may take a while.