Fig. 6
Download original image
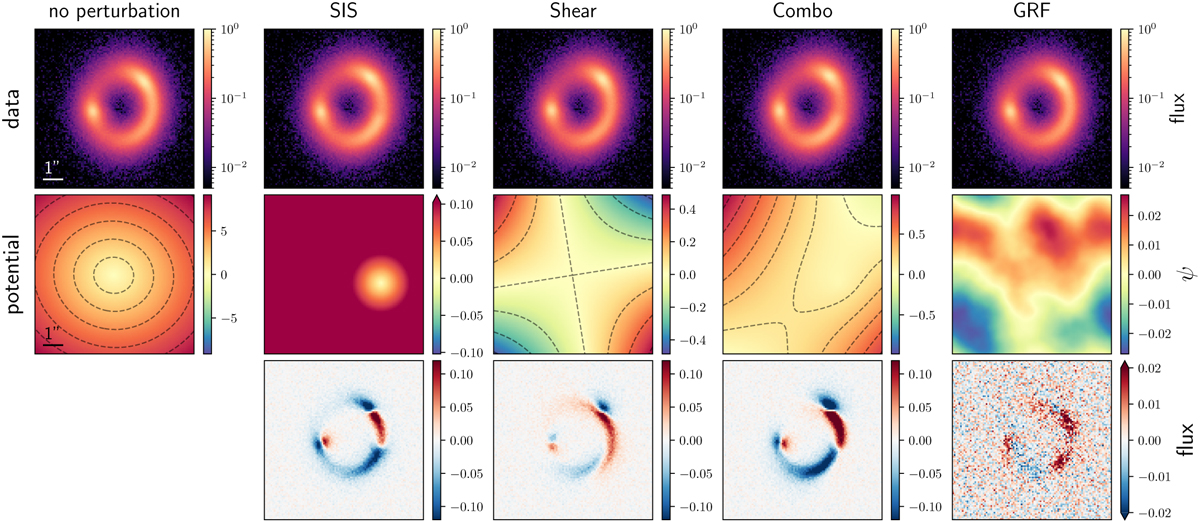
Mock data modeled in this work. The leftmost column shows the image and lensing potential of a mock; system without any perturbations, while subsequent columns show the mock image (first row) of the same system under the influence of a different perturbing potential (second row). The difference with the unperturbed case is shown in the bottom row. Details on generating the mocks and the parameters of the system and perturbations are given in Sect:. 4 and in Tables 1 and 2. The Combo case is simply a combination of the SIS and Shear perturbations. Contours are shown for the Shear and Combo cases to better trace the shape of the lensing potential. We also note that the GRF perturbing potential has 2–5 times lower amplitude than the other ones.
Current usage metrics show cumulative count of Article Views (full-text article views including HTML views, PDF and ePub downloads, according to the available data) and Abstracts Views on Vision4Press platform.
Data correspond to usage on the plateform after 2015. The current usage metrics is available 48-96 hours after online publication and is updated daily on week days.
Initial download of the metrics may take a while.