Fig. 4
Download original image
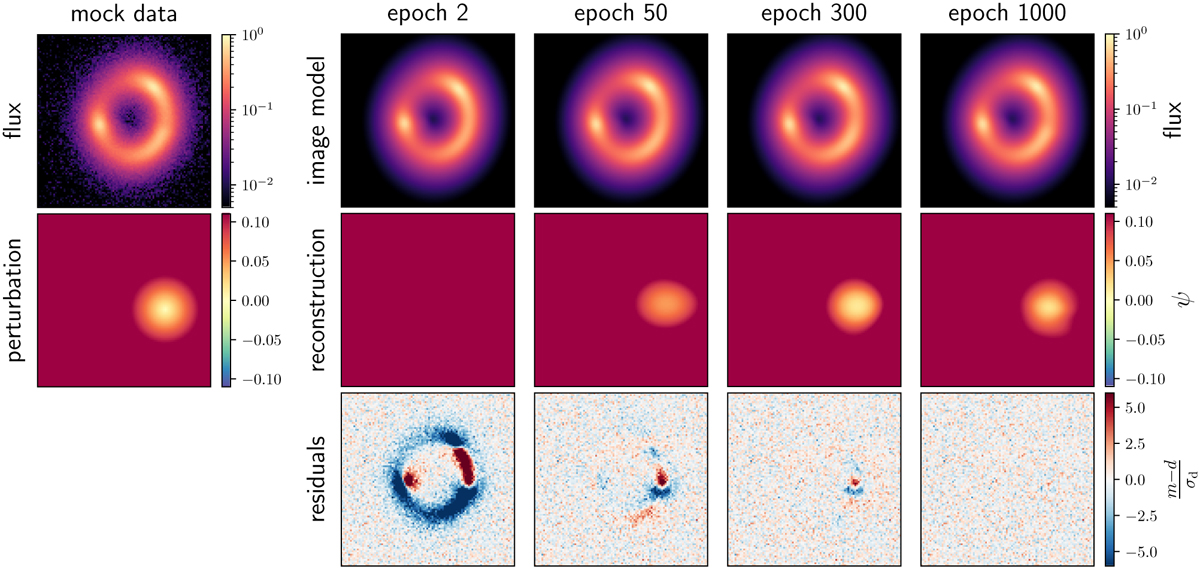
Evolution of the network output prediction when modeling an example localized perturbation to a smooth lens potential. Mock noisy lensing image data and the true perturbation are shown on the left. The predicted lensing image, the network reconstruction of ψpert, and residuals between the data and the predicted image at different training epochs are also shown. Training is performed via back-propagation of the gradients through the simulator, as presented in Fig. 2.
Current usage metrics show cumulative count of Article Views (full-text article views including HTML views, PDF and ePub downloads, according to the available data) and Abstracts Views on Vision4Press platform.
Data correspond to usage on the plateform after 2015. The current usage metrics is available 48-96 hours after online publication and is updated daily on week days.
Initial download of the metrics may take a while.