Fig. 31.
Download original image
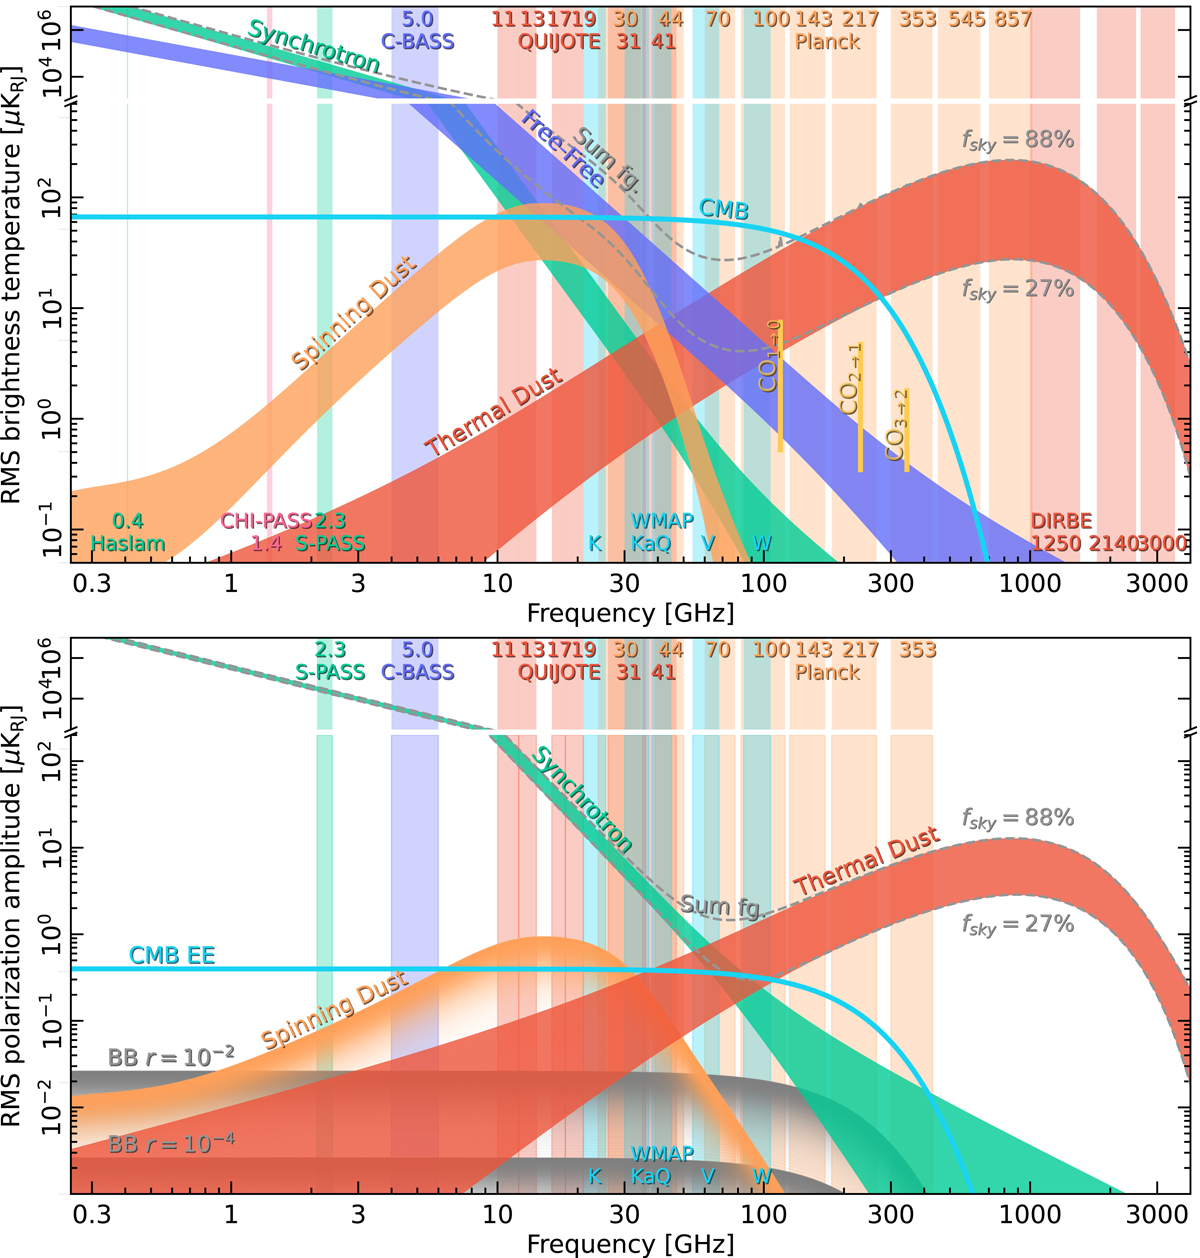
Brightness temperature (top panel) and polarization amplitude (bottom panel) rms as a function of frequency and astrophysical component, and as derived from the BEYONDPLANCK and Planck sky models. Vertical bands indicate the frequency ranges of various experiment. All components have been evaluated at a common angular resolution of 1° FWHM. The widths of each confidence region correspond to the spread when evaluating the rms over two different masks with sky fractions of 88 and 27%, respectively. The cyan curve shows the level of CMB fluctuations evaluated for the best-fit PlanckΛCDM spectrum. In the current BEYONDPLANCK analysis, only the three LFI channels are modeled in the time-domain. For polarization, the spinning dust component (orange curve) indicates an upper limit as presented by Herman et al. (2023), not a detection. A long-term future goal is to include all publicly available and relevant data (for instance WMAP and Planck HFI) into this model; preferably in the form of time-ordered data, but if this is not technically or financially possible, then at least in the form of preprocessed sky maps. This work will be organized within the COSMOGLOBE project.
Current usage metrics show cumulative count of Article Views (full-text article views including HTML views, PDF and ePub downloads, according to the available data) and Abstracts Views on Vision4Press platform.
Data correspond to usage on the plateform after 2015. The current usage metrics is available 48-96 hours after online publication and is updated daily on week days.
Initial download of the metrics may take a while.