Fig. 21.
Download original image
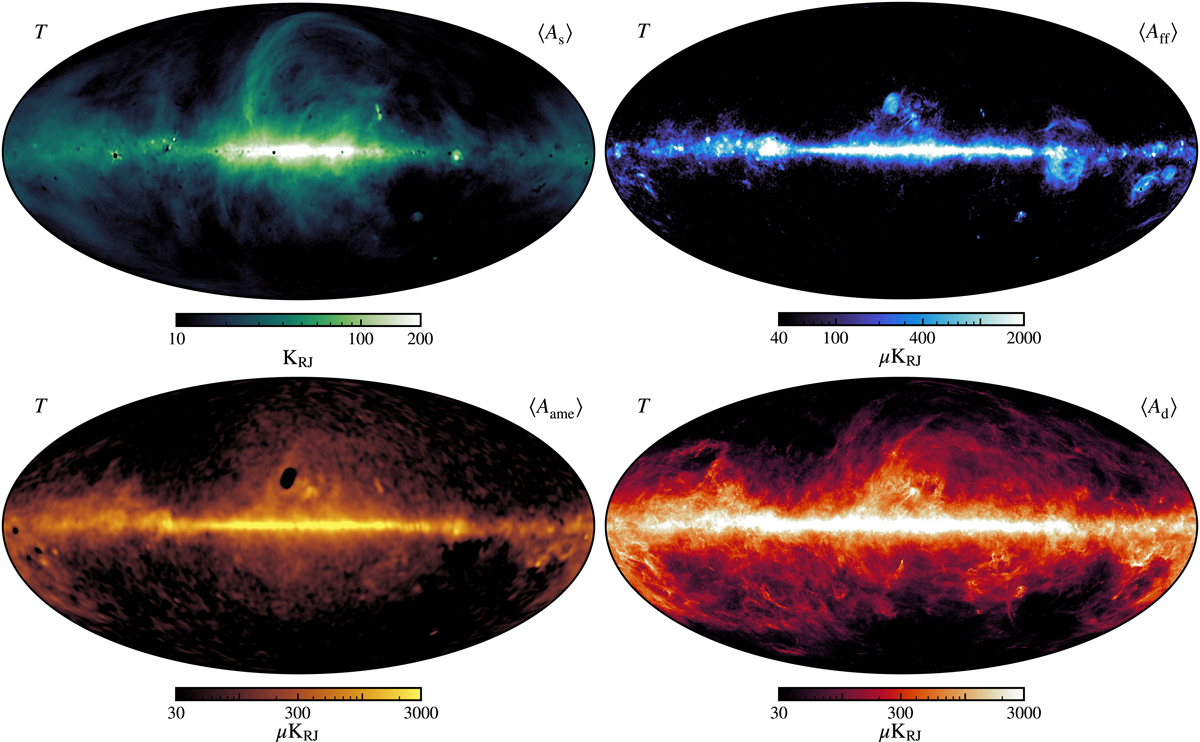
Posterior mean maps of the amplitude of each of the four intensity foreground components included in the BEYONDPLANCK analysis. Top left: synchrotron amplitude, evaluated at 30 GHz and smoothed to 2° FWHM resolution. Top right: free-free amplitude, evaluated at 40 GHz and smoothed to 30′ FWHM resolution. Bottom left: AME amplitude, evaluated at 22 GHz and smoothed to 2° FWHM resolution. Bottom right: thermal dust amplitude, evaluated at 545 GHz and smoothed to 10′ FWHM resolution. The color bars vary between panels. See Andersen et al. (2023) for further discussion of these maps.
Current usage metrics show cumulative count of Article Views (full-text article views including HTML views, PDF and ePub downloads, according to the available data) and Abstracts Views on Vision4Press platform.
Data correspond to usage on the plateform after 2015. The current usage metrics is available 48-96 hours after online publication and is updated daily on week days.
Initial download of the metrics may take a while.