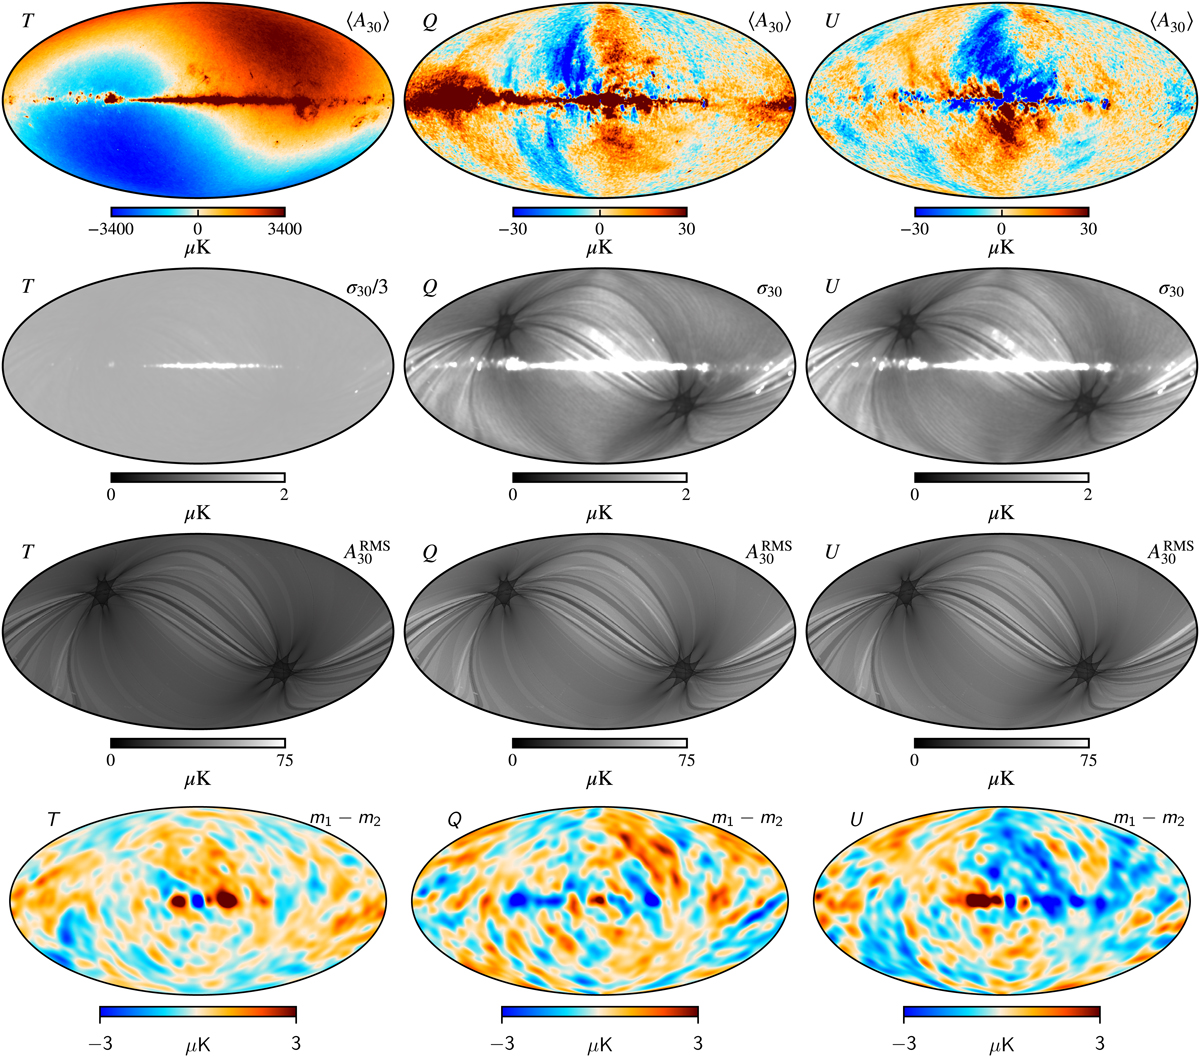
Fig. 18.
Download original image
Posterior summary maps for the LFI 30 GHz channel. Columns show the temperature and Stokes Q and U parameters, while rows show, from top to bottom, the posterior mean, the posterior standard deviation, the white noise rms per pixel, and the difference between two random individual Gibbs samples. The polarization maps in the two rows have been smoothed to an angular resolution of 1° FWHM to visually reduce the noise level, while the bottom row is smoothed to 7° FWHM.
Current usage metrics show cumulative count of Article Views (full-text article views including HTML views, PDF and ePub downloads, according to the available data) and Abstracts Views on Vision4Press platform.
Data correspond to usage on the plateform after 2015. The current usage metrics is available 48-96 hours after online publication and is updated daily on week days.
Initial download of the metrics may take a while.