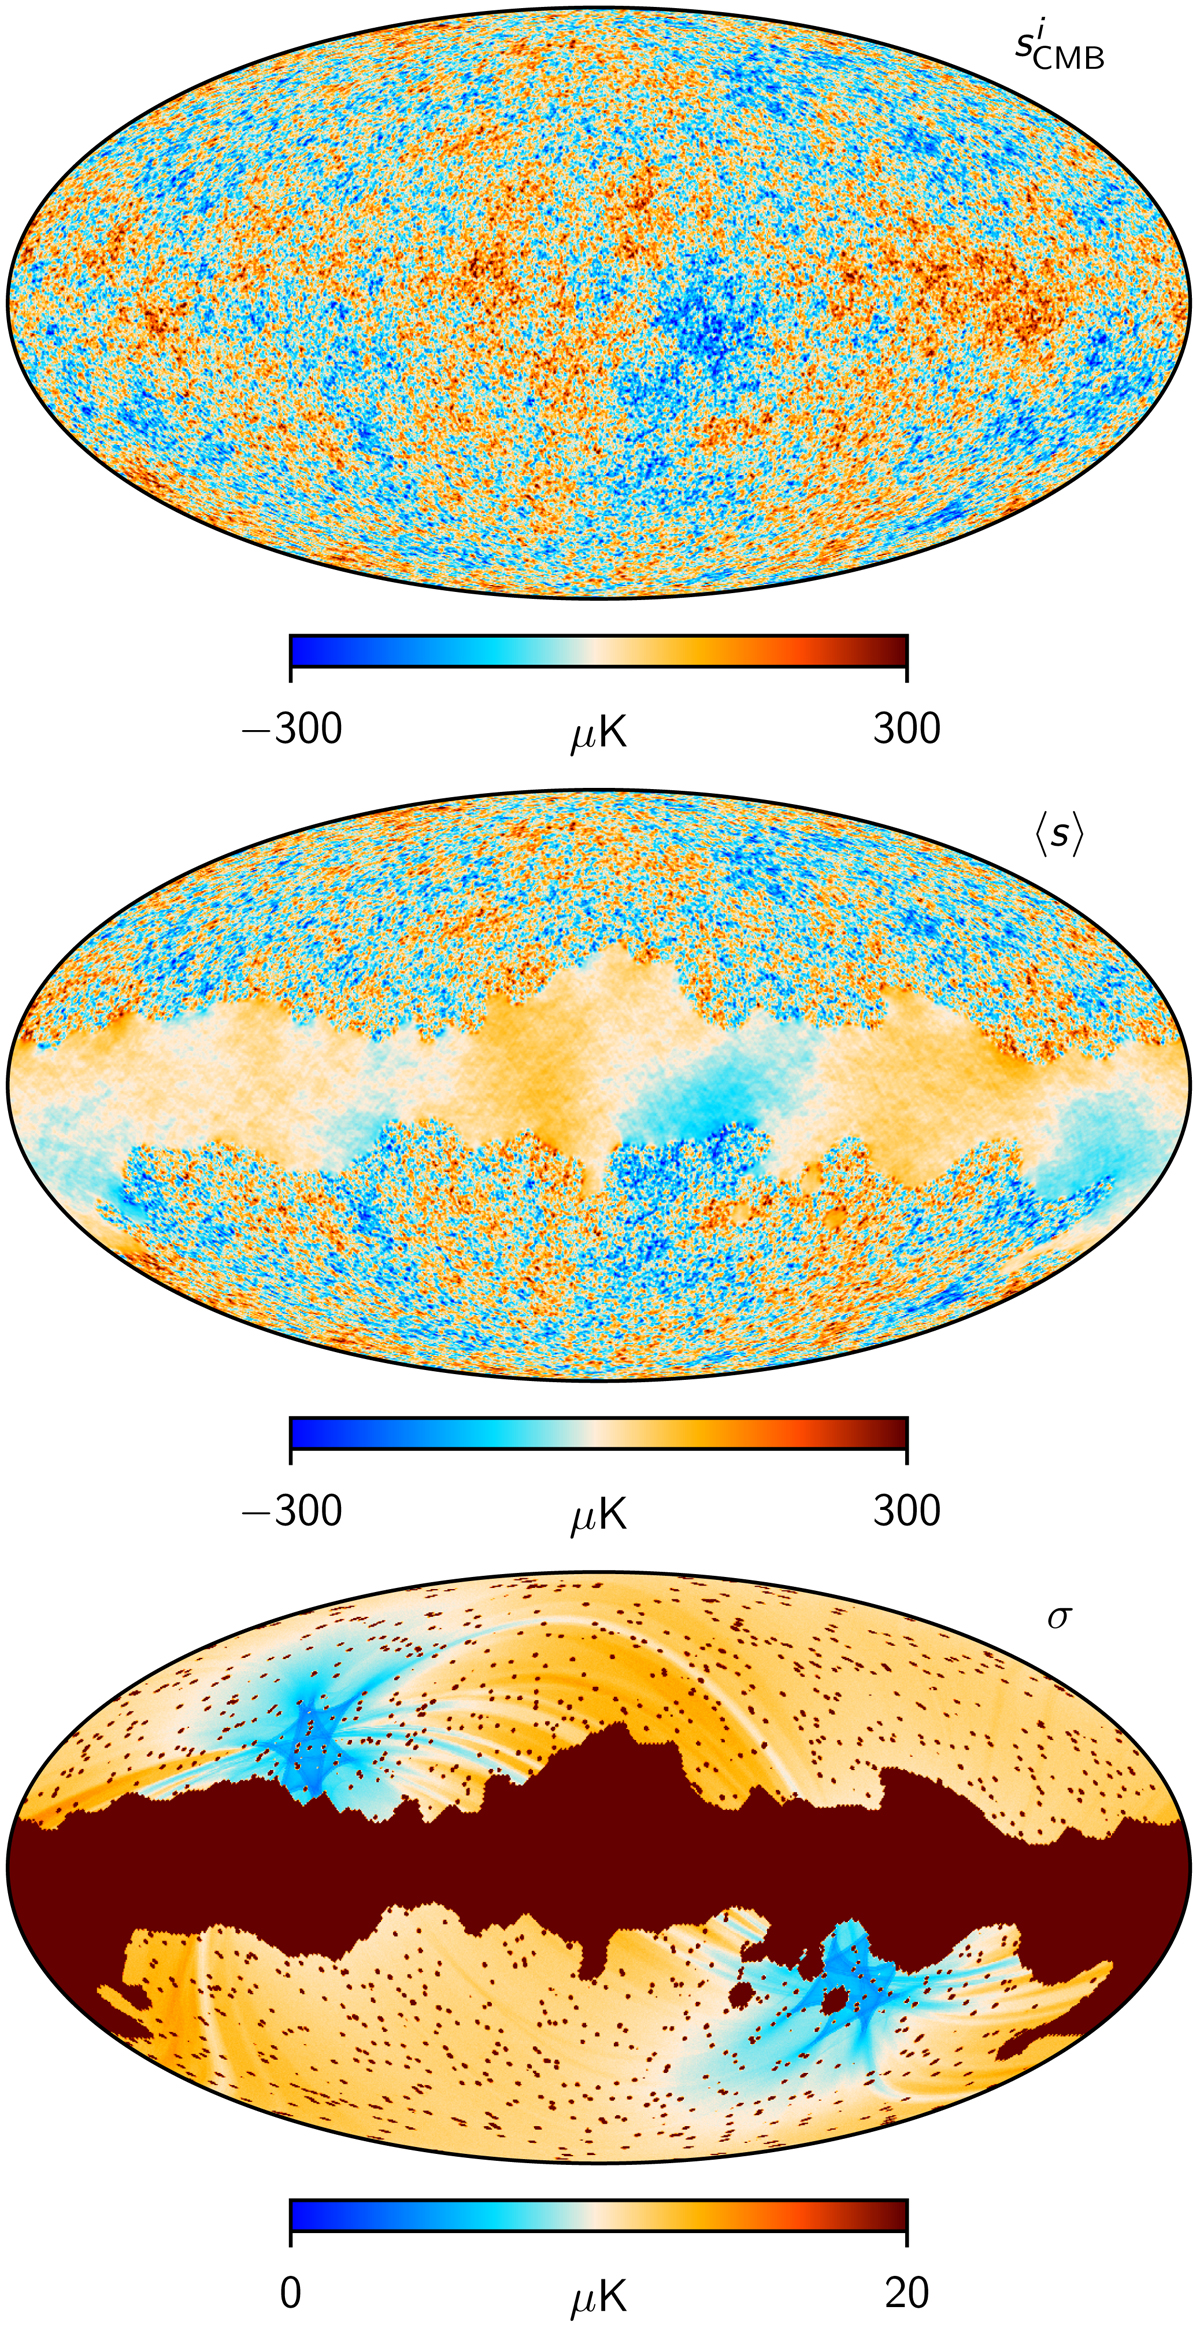
Fig. 2.
Download original image
Full-resolution CMB temperature constrained realization maps. Top: single constrained realization, si, drawn from P(s ∣ d, Cℓ, …). Middle: posterior mean map, ⟨s⟩, as evaluated from the ensemble of constrained CMB realizations; note that the small-scale signal amplitude inside the mask decreases smoothly to zero with increasing distance from the edge of the mask. Bottom: CMB posterior standard deviation map, as evaluated pixel-by-pixel from the ensemble of constrained CMB realizations. This map is dominated by instrumental noise outside the mask and by random fluctuations informed by the assumptions of isotropy and Gaussianity inside the mask. The CMB Solar dipole has been removed from the top two panels.
Current usage metrics show cumulative count of Article Views (full-text article views including HTML views, PDF and ePub downloads, according to the available data) and Abstracts Views on Vision4Press platform.
Data correspond to usage on the plateform after 2015. The current usage metrics is available 48-96 hours after online publication and is updated daily on week days.
Initial download of the metrics may take a while.