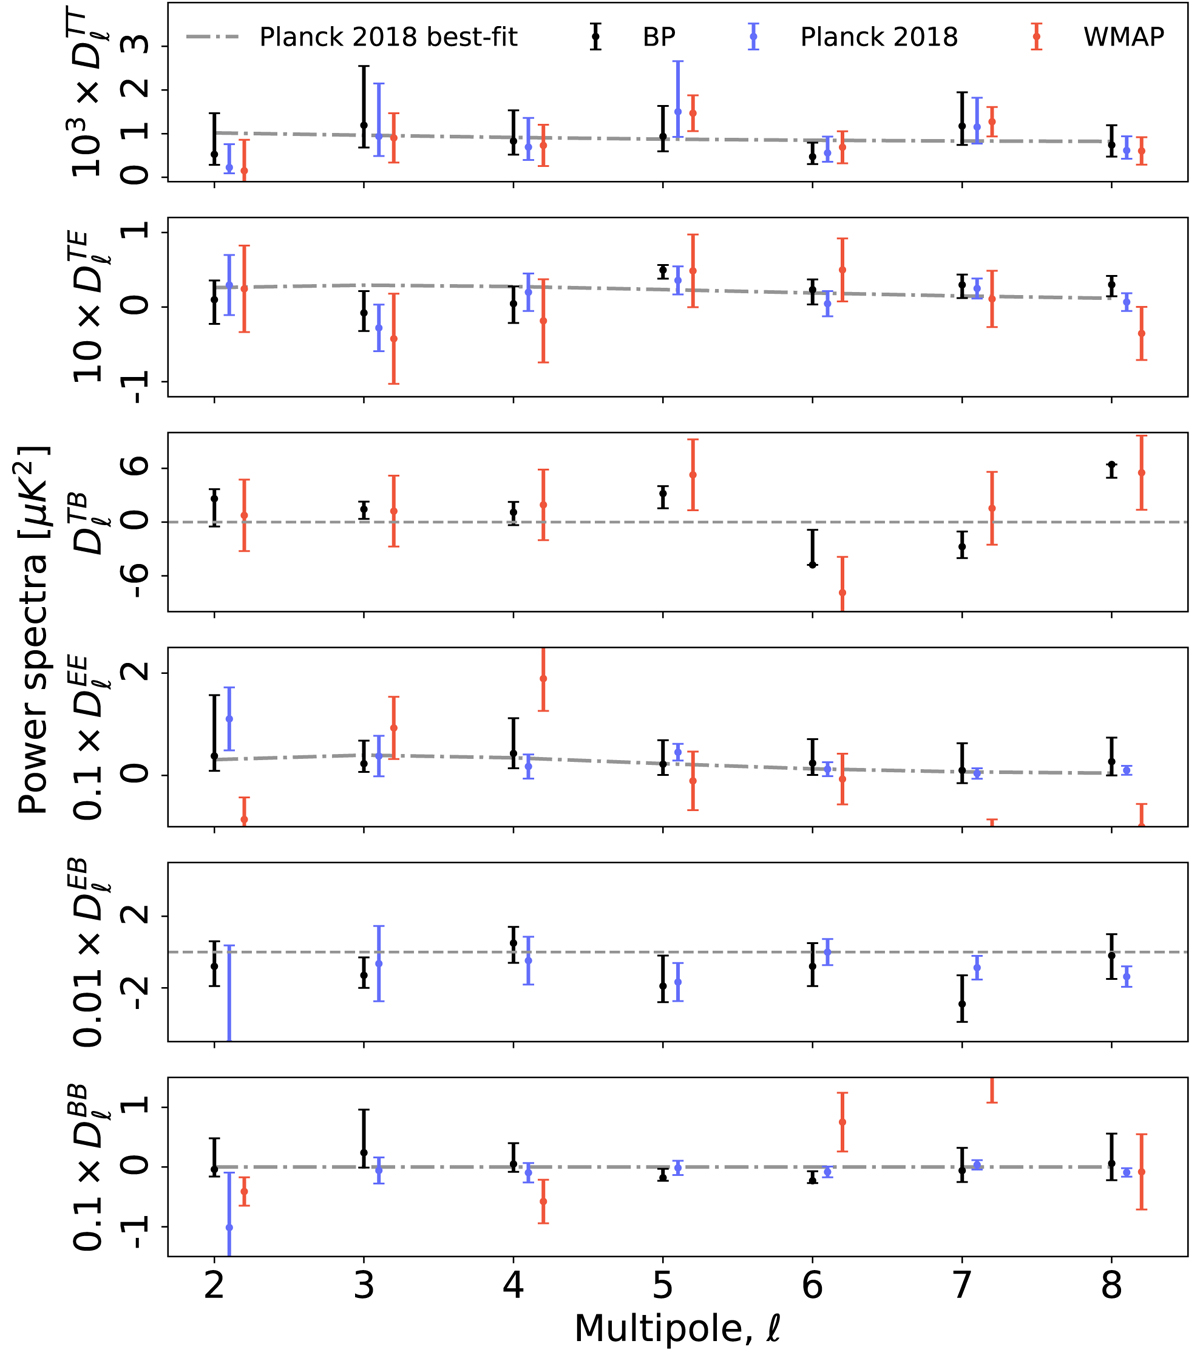
Fig. 16.
Download original image
Comparison between low-ℓ angular CMB power spectra, as derived by the Planck Collaboration using both LFI and HFI data (blue points; Planck Collaboration V 2020), by the WMAP team using just WMAP data (red points; Hinshaw et al. 2013), and by BEYONDPLANCK using both LFI and WMAP data (black points; this work). Thin black lines indicate the Planck 2018 best-fit ΛCDM spectrum (Planck Collaboration VI 2020). The BEYONDPLANCK data points are evaluated by conditionally slicing the posterior distribution ℓ-by-ℓ with respect to the best-fit ΛCDM model, by holding all other multipoles fixed at the reference spectrum while mapping out P(Cℓ ∣ d), to visualize the posterior structure around the peak. For WMAP, the reported BB octopole amplitude is ![]() , which is outside the plotted range.
, which is outside the plotted range.
Current usage metrics show cumulative count of Article Views (full-text article views including HTML views, PDF and ePub downloads, according to the available data) and Abstracts Views on Vision4Press platform.
Data correspond to usage on the plateform after 2015. The current usage metrics is available 48-96 hours after online publication and is updated daily on week days.
Initial download of the metrics may take a while.