Fig. 5.
Download original image
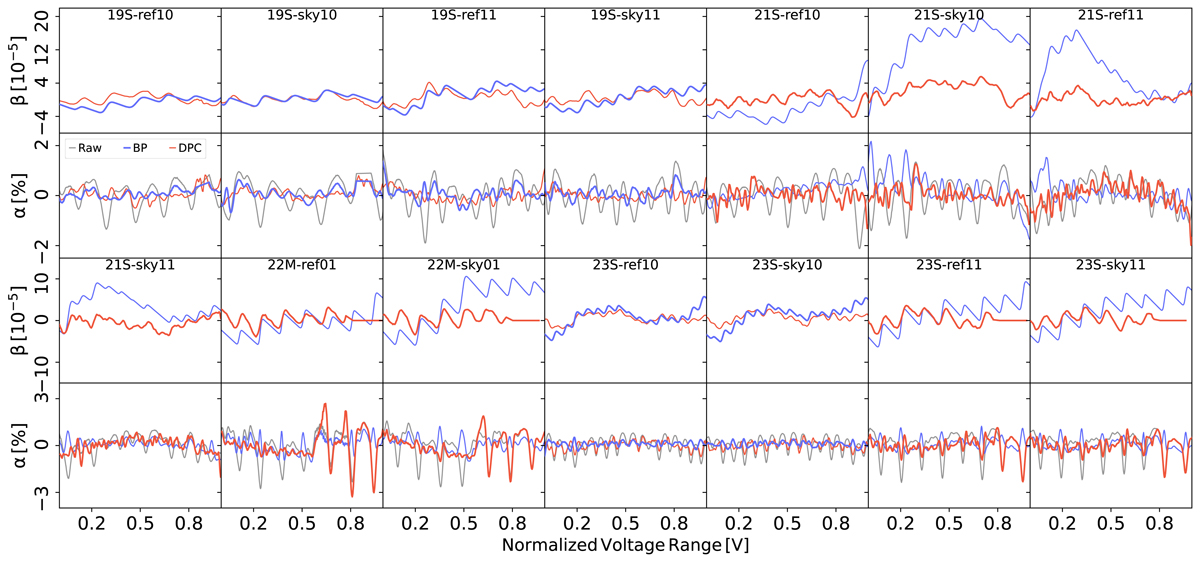
Same as Fig. 4 for 70 GHz (14 out of 48 data streams). The data streams corrected with the minimal BEYONDPLANCK approach are shown with the thicker line in blue, while the DPC tables are adopted for the data streams with the red line as the thickest.
Current usage metrics show cumulative count of Article Views (full-text article views including HTML views, PDF and ePub downloads, according to the available data) and Abstracts Views on Vision4Press platform.
Data correspond to usage on the plateform after 2015. The current usage metrics is available 48-96 hours after online publication and is updated daily on week days.
Initial download of the metrics may take a while.