Fig. 2.
Download original image
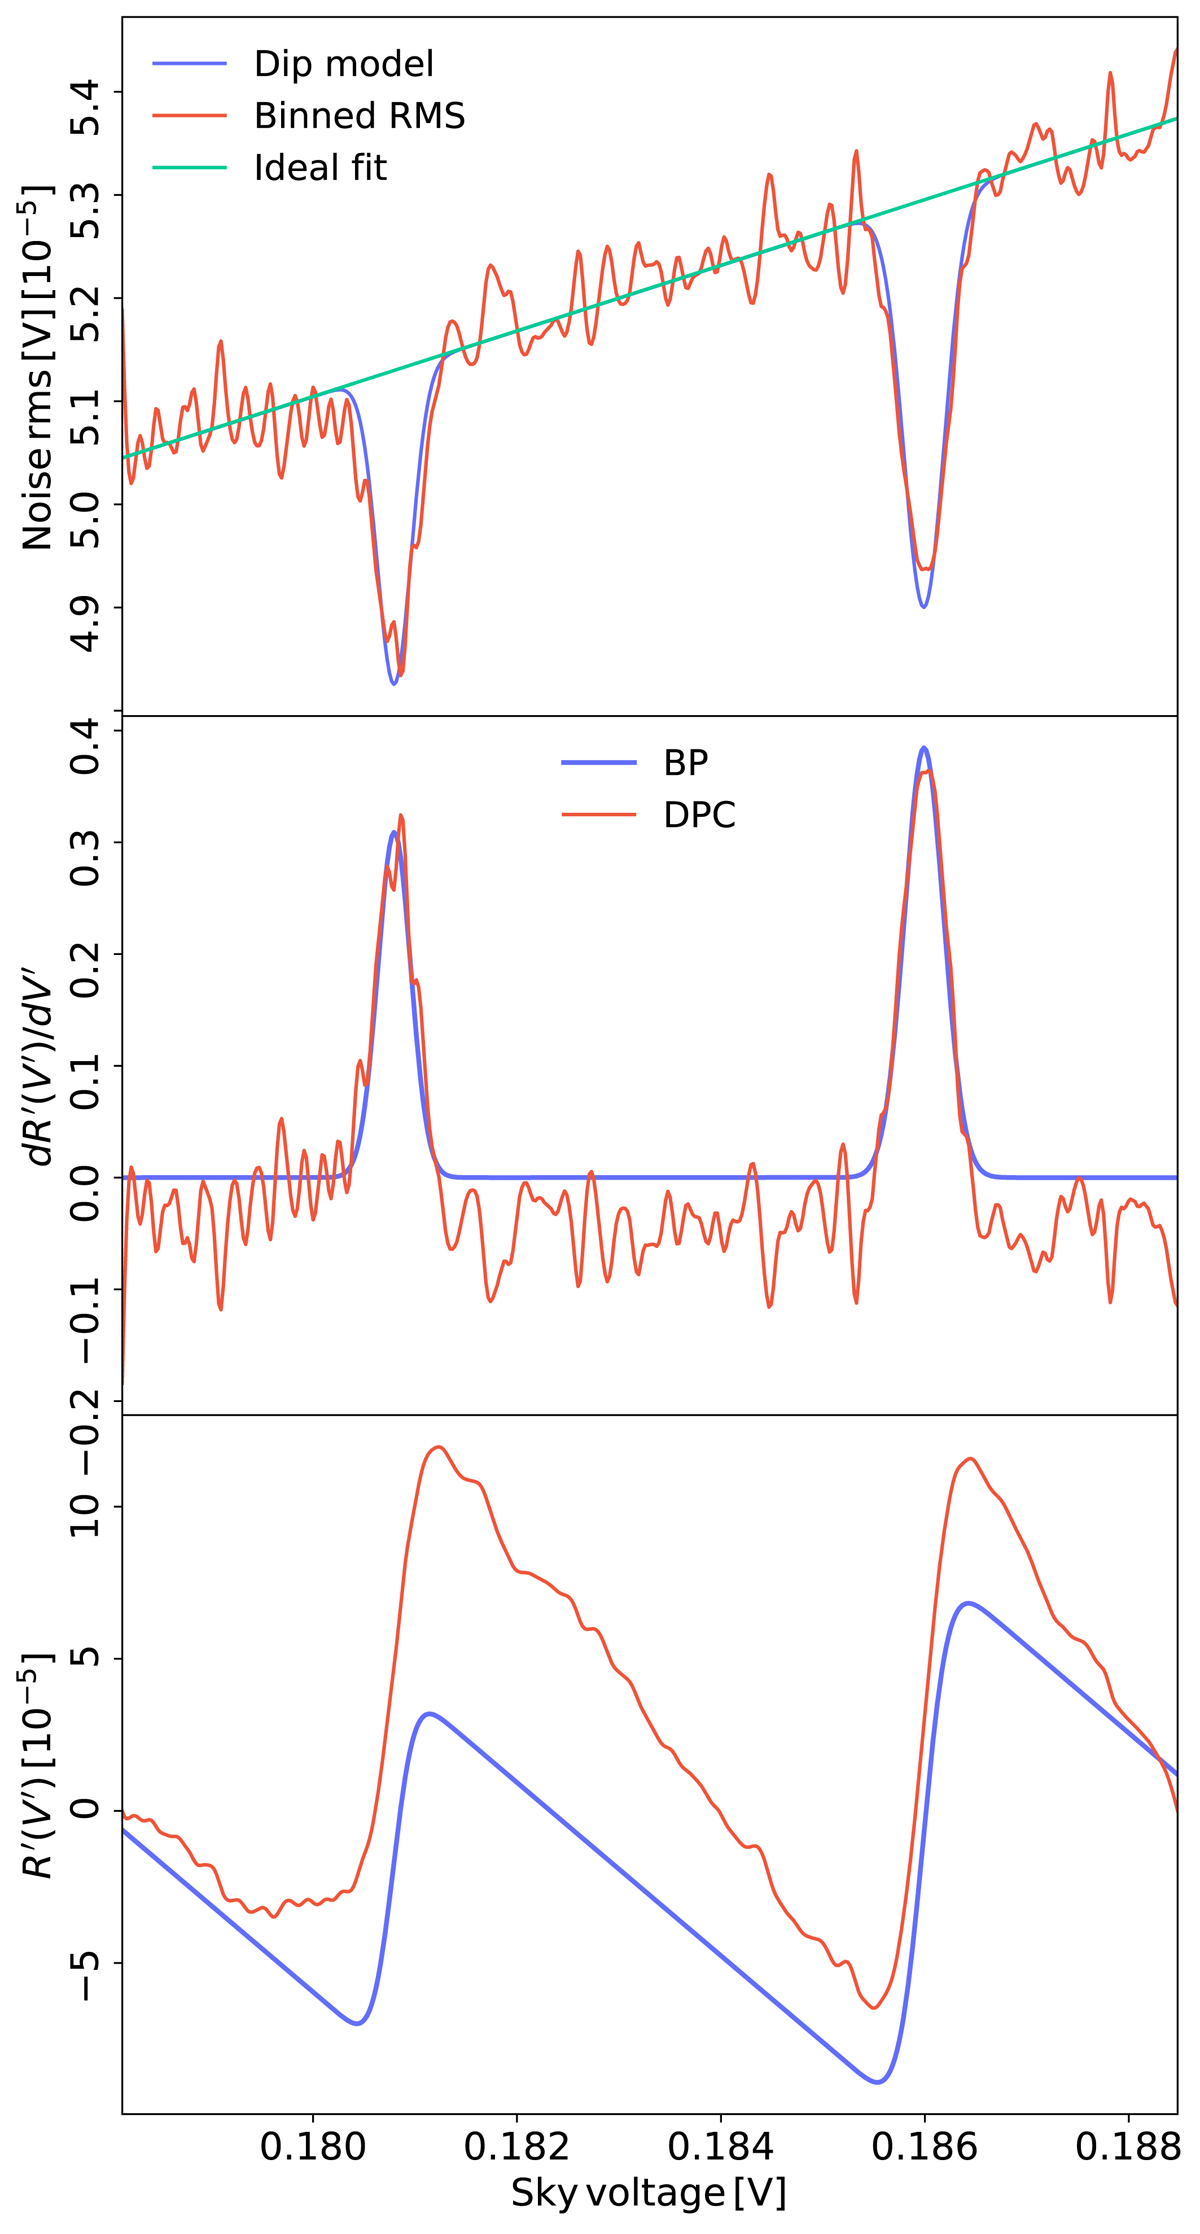
Top: Raw binned rms profile, δV′ (red), compared with a Gaussian fit (blue) and an ideal linear function (green) for a single data stream. Middle: Inverse differential response function, dR′(V′)/dV′, for the same data stream, as computed with the DPC (red) and BEYONDPLANCK (blue) approaches. Bottom: Constructed inverse response function, R′(V′), for both DPC and BEYONDPLANCK.
Current usage metrics show cumulative count of Article Views (full-text article views including HTML views, PDF and ePub downloads, according to the available data) and Abstracts Views on Vision4Press platform.
Data correspond to usage on the plateform after 2015. The current usage metrics is available 48-96 hours after online publication and is updated daily on week days.
Initial download of the metrics may take a while.