Fig. 7
Download original image
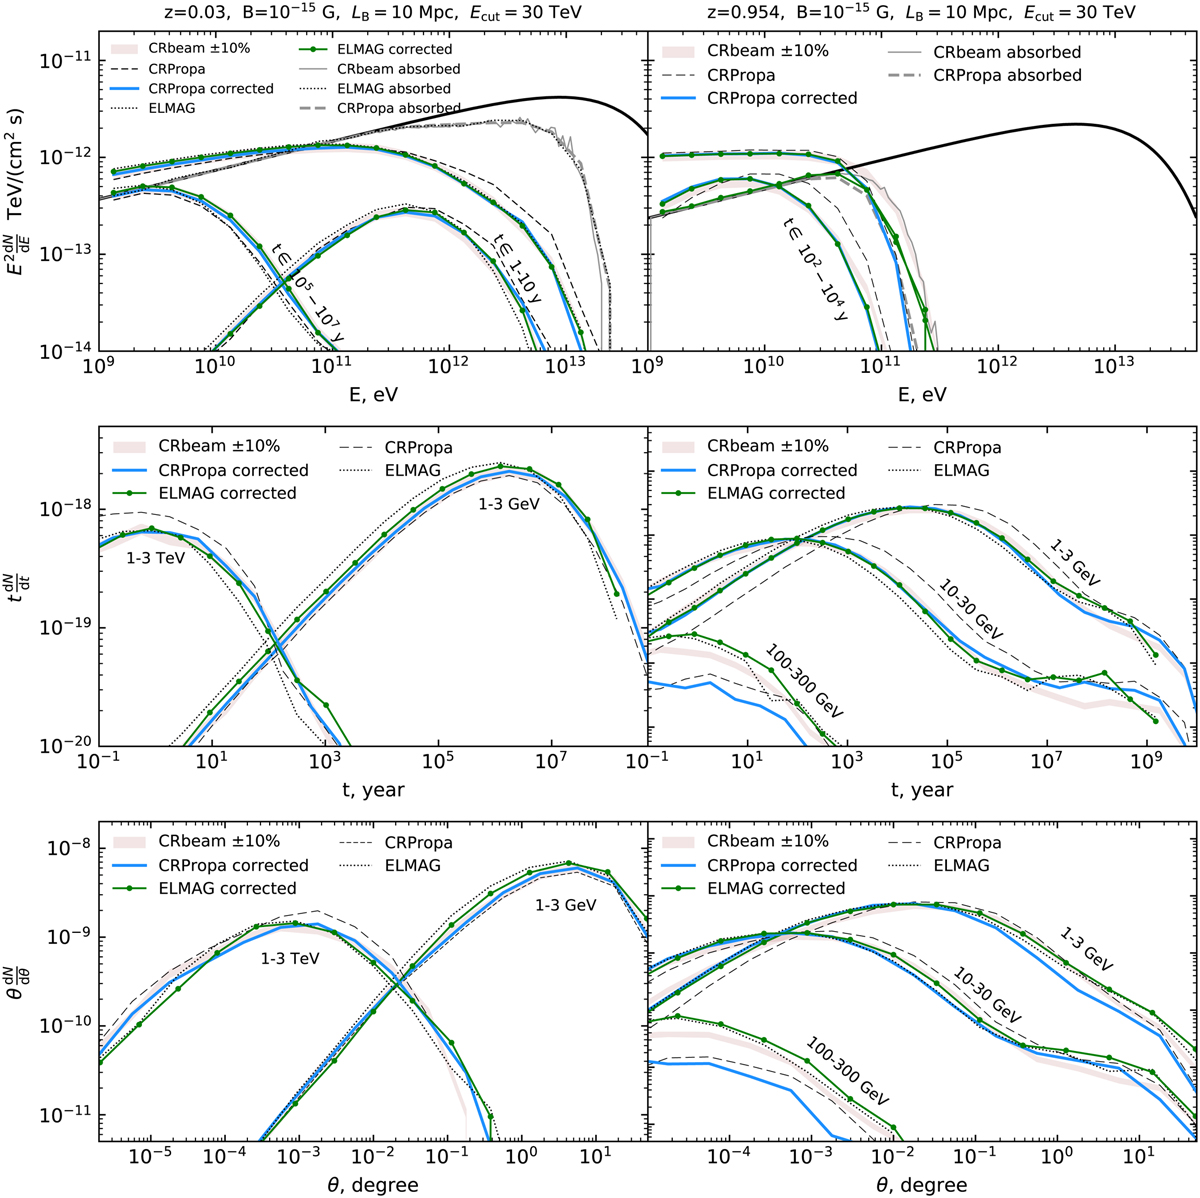
Spectral (top), timing (middle), and imaging (bottom) properties of primary and secondary γ-ray signals for a IGMF with strength 10−15 G and maximum scale LB = 10 Mpc. Left panels show calculations for the source at redshift z = 0.03, right panels are for the source at redshift z = 0.954. Calculations with CRbeam code (pink solid) compared with CRPropa (black thin solid), corrected CRPropa (blue solid), ELMAG (black dotted), and corrected ELMAG (green solid with dots) codes. The cascade signals on the upper panels are shown for the sources been active in the past in the time intervals indicated as tags near the curves while the curve without the tag corresponds to the permanently active source. The intrinsic spectrum of the source (thick black solid line) remains fixed during source activity. Note: on the plots of the angular and time distributions, the relative normalization of the curves for different energies is adjusted for visibility.
Current usage metrics show cumulative count of Article Views (full-text article views including HTML views, PDF and ePub downloads, according to the available data) and Abstracts Views on Vision4Press platform.
Data correspond to usage on the plateform after 2015. The current usage metrics is available 48-96 hours after online publication and is updated daily on week days.
Initial download of the metrics may take a while.