Fig. 4.
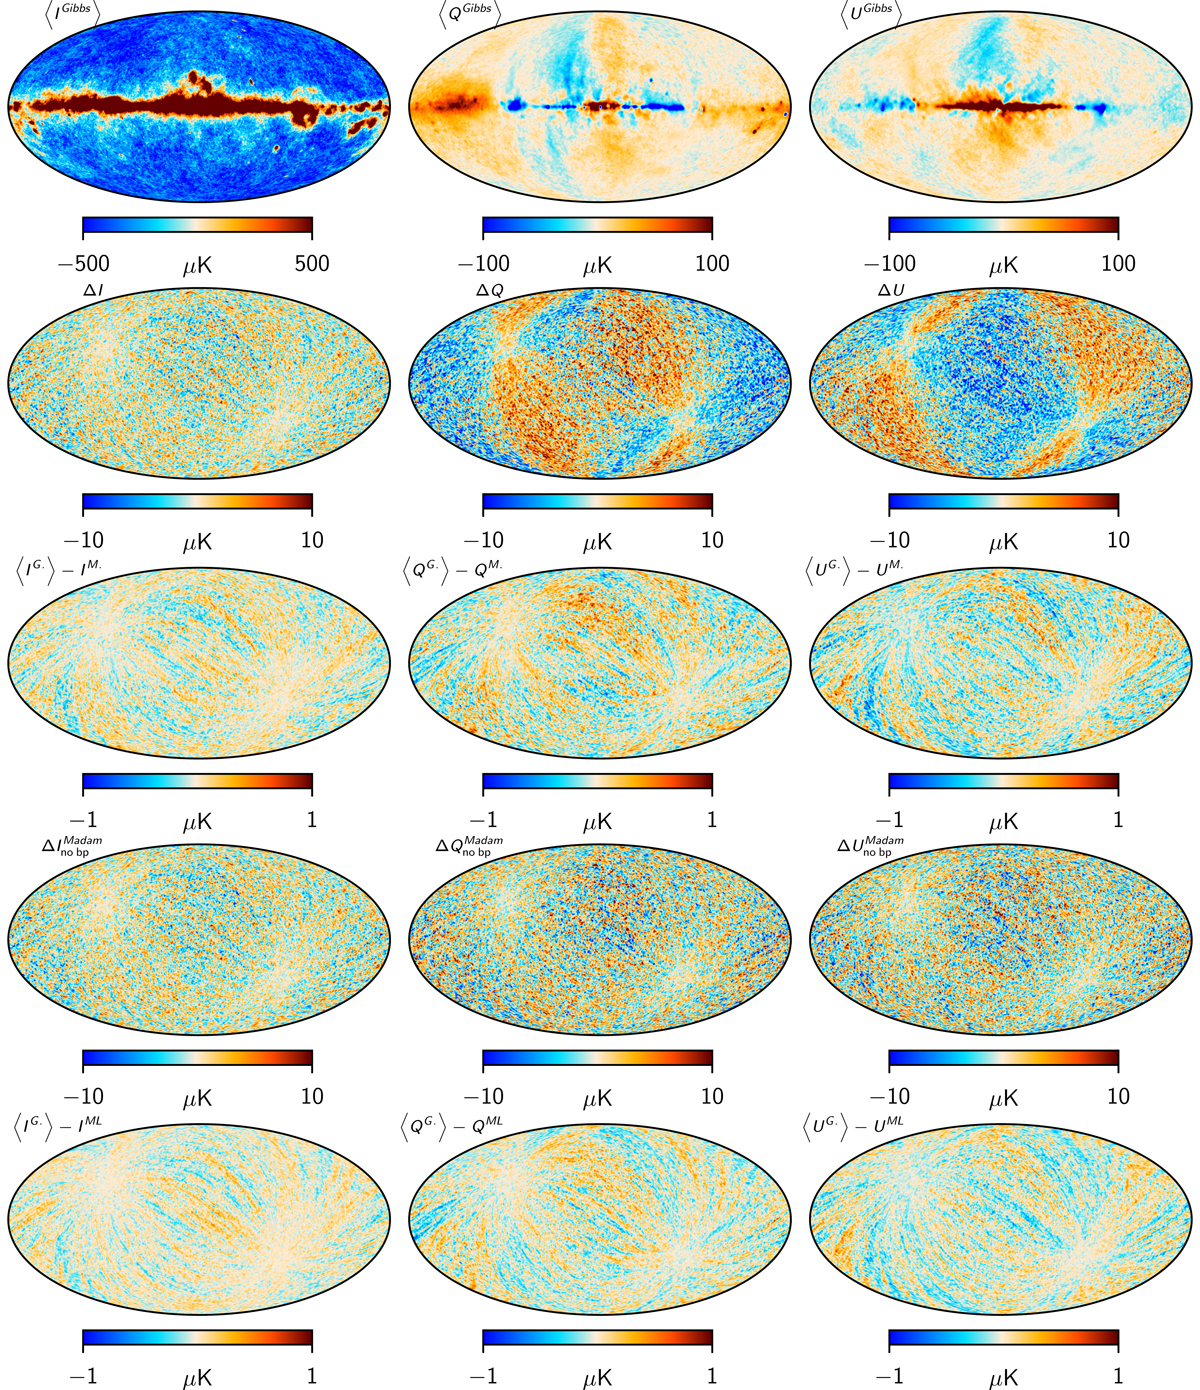
Download original image
Temperature and polarization maps from simulation. Columns show, from left to right, the Stokes T, Q, and U components. Rows show, from top to bottom, (1) Gibbs map: the mean of maps from the Gibbs chain, as evaluated from 900 samples; (2) absolute residual error as evaluated as the difference between the Gibbs map and the noise-free map; (3) the difference between the Gibbs map and the Madam map derived from the same data set; (4) residual error in Madam for a simulation that does not contain bandpass (i.e., a simulation with same input foreground map for all radiometers) evaluated as the difference between the Madam map and noise-free map; and (5) the difference between the Gibbs map and the maximum-likelihood map.
Current usage metrics show cumulative count of Article Views (full-text article views including HTML views, PDF and ePub downloads, according to the available data) and Abstracts Views on Vision4Press platform.
Data correspond to usage on the plateform after 2015. The current usage metrics is available 48-96 hours after online publication and is updated daily on week days.
Initial download of the metrics may take a while.