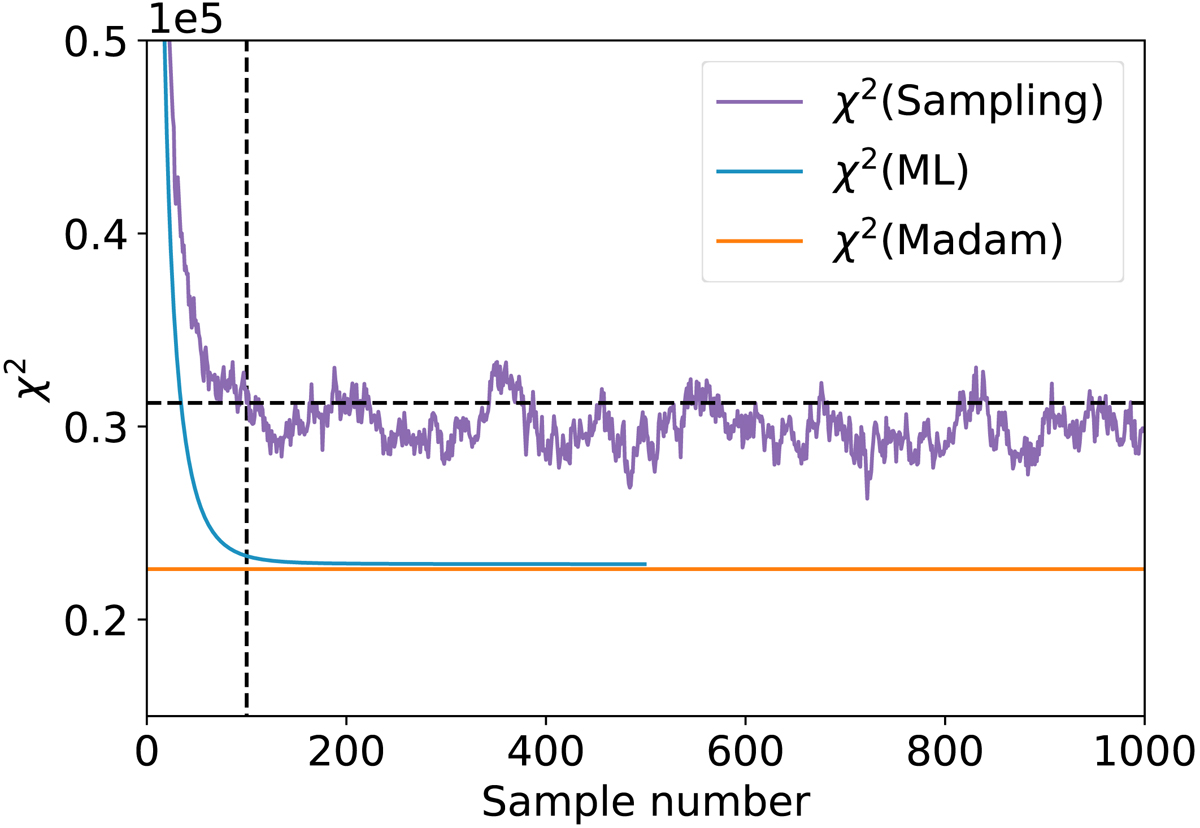
Fig. 1.
Download original image
Gibbs chain burn-in as illustrated by the χ2 difference between a given Gibbs sample and the noise-free reference map. The dashed line shows the χ2 level after 100 steps. The χ2 value from Madam is shown by a horizontal line.
Current usage metrics show cumulative count of Article Views (full-text article views including HTML views, PDF and ePub downloads, according to the available data) and Abstracts Views on Vision4Press platform.
Data correspond to usage on the plateform after 2015. The current usage metrics is available 48-96 hours after online publication and is updated daily on week days.
Initial download of the metrics may take a while.