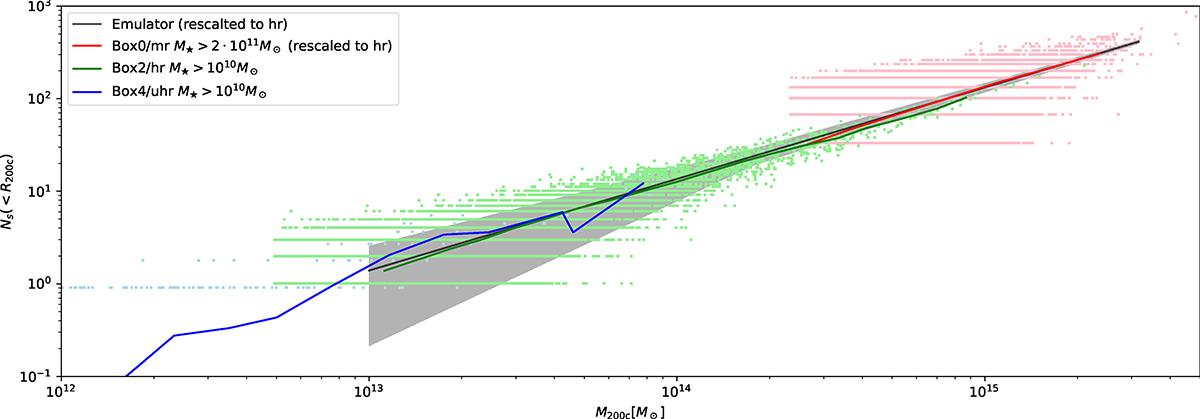
Fig. 7.
Download original image
Satellite count Ns, 200c vs. halo mass M200c for three Magneticum simulations, Box4/uhr (blue coloured and moved slightly down to improve readability), Box2/hr (green coloured), and Box0/mr (red colour) to account for resolution effects. Data points represent single haloes and coloured lines represent average values per mass bin. The black line is the emulator prediction, and the shaded area corresponds to the relative uncertainty from Poisson distribution. Emulator and Box0/mr data are rescaled with Eq. (3).
Current usage metrics show cumulative count of Article Views (full-text article views including HTML views, PDF and ePub downloads, according to the available data) and Abstracts Views on Vision4Press platform.
Data correspond to usage on the plateform after 2015. The current usage metrics is available 48-96 hours after online publication and is updated daily on week days.
Initial download of the metrics may take a while.