Fig. 6.
Download original image
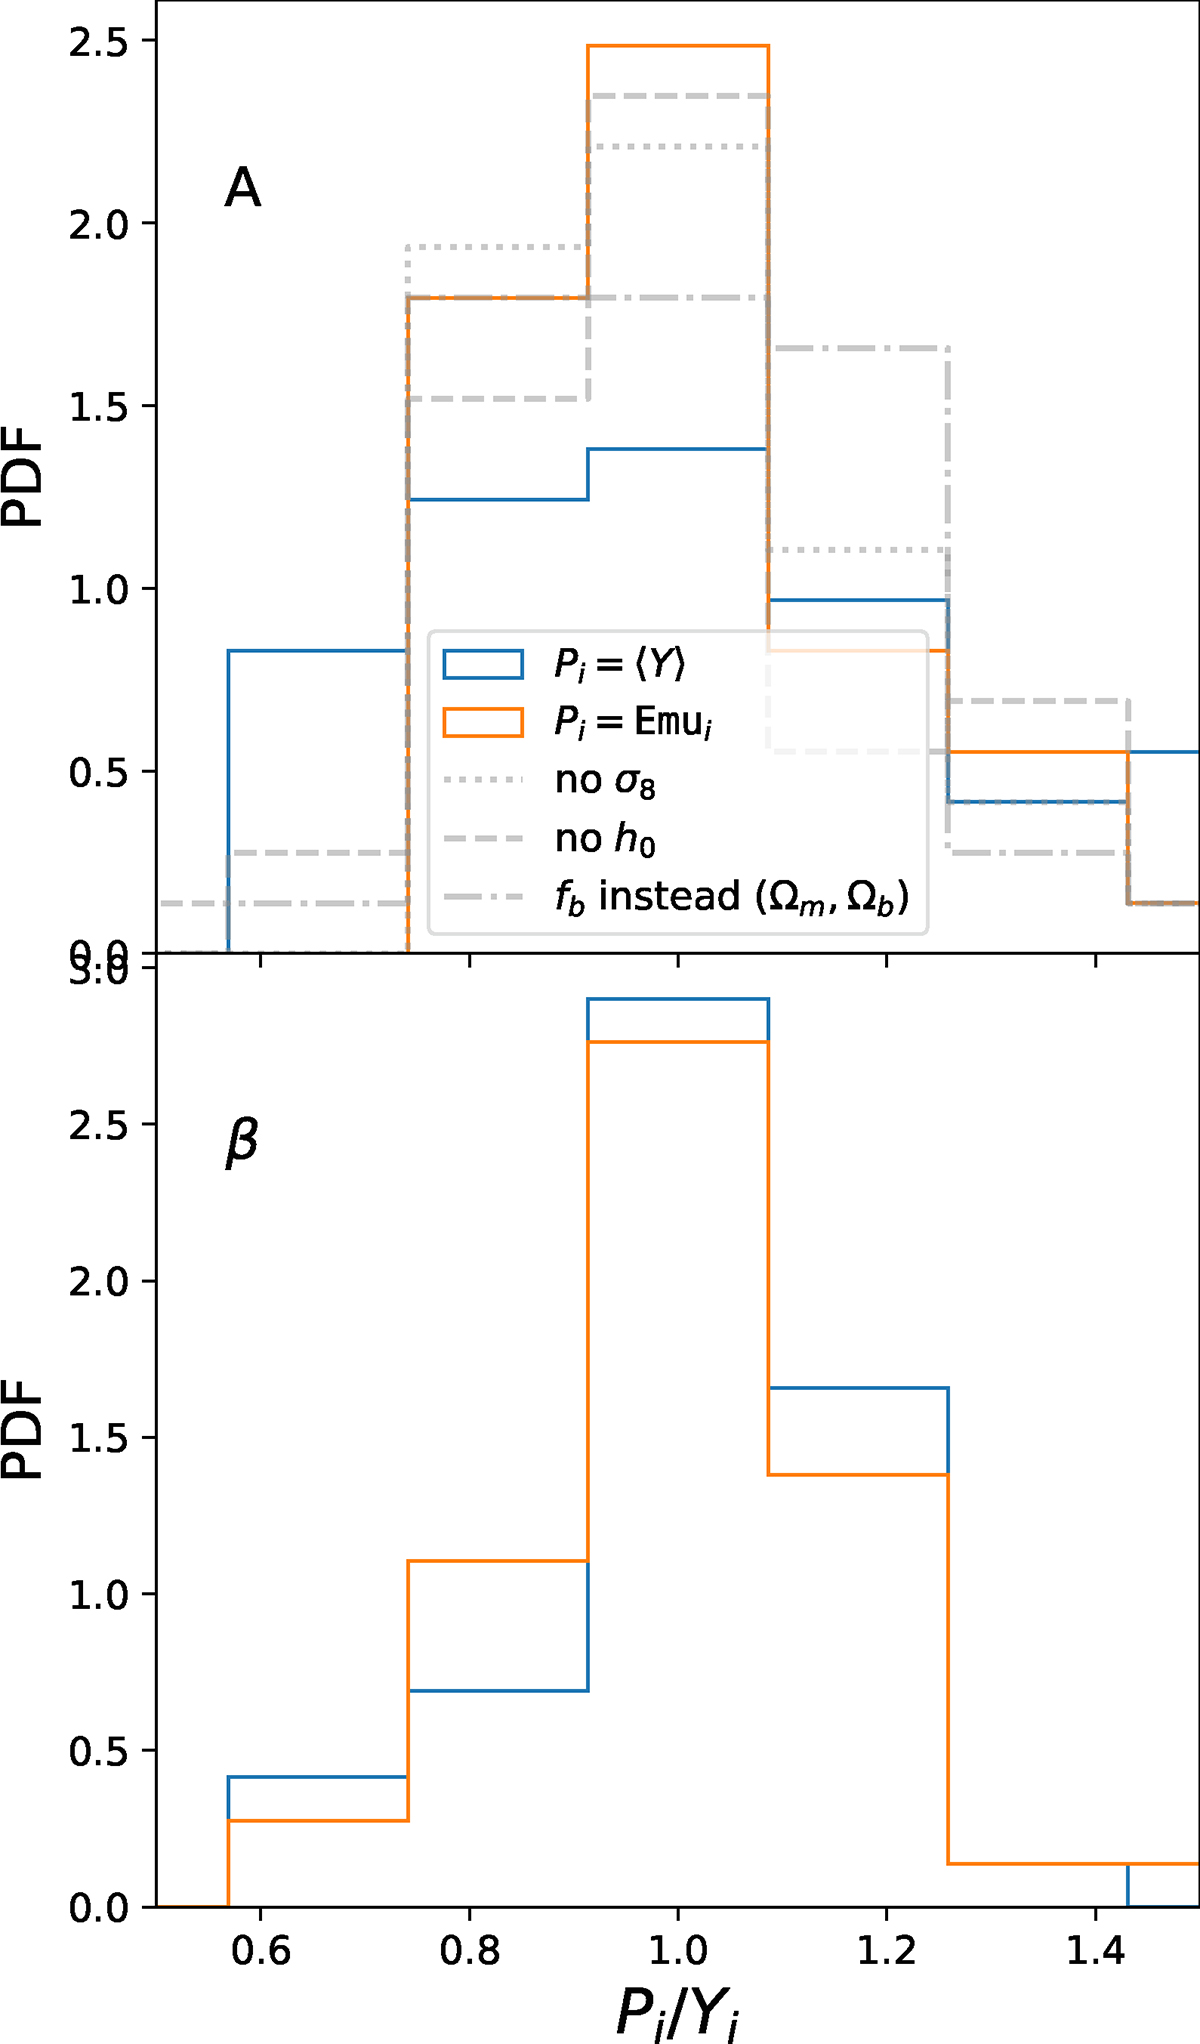
PDF of residuals for predictor Pi = Emui and the residual based on predictions from the average values (Pi = ⟨Y⟩), with respect to the missing data point yi. Data are computed on overdensity Δ200c. The upper row shows the PDF for yi = Ai (normalisation), and the lower row shows the PDF for yi = βi (log-slope). The scatter obtained with the emulator is significantly smaller than the residuals on average. Grey lines correspond to the residuals when the emulator is trained without either σ8 (dotted line), h0 (dashed line), or when using Ωb/Ωm instead of training it with Ωb and Ωm separately (dash-dotted line).
Current usage metrics show cumulative count of Article Views (full-text article views including HTML views, PDF and ePub downloads, according to the available data) and Abstracts Views on Vision4Press platform.
Data correspond to usage on the plateform after 2015. The current usage metrics is available 48-96 hours after online publication and is updated daily on week days.
Initial download of the metrics may take a while.