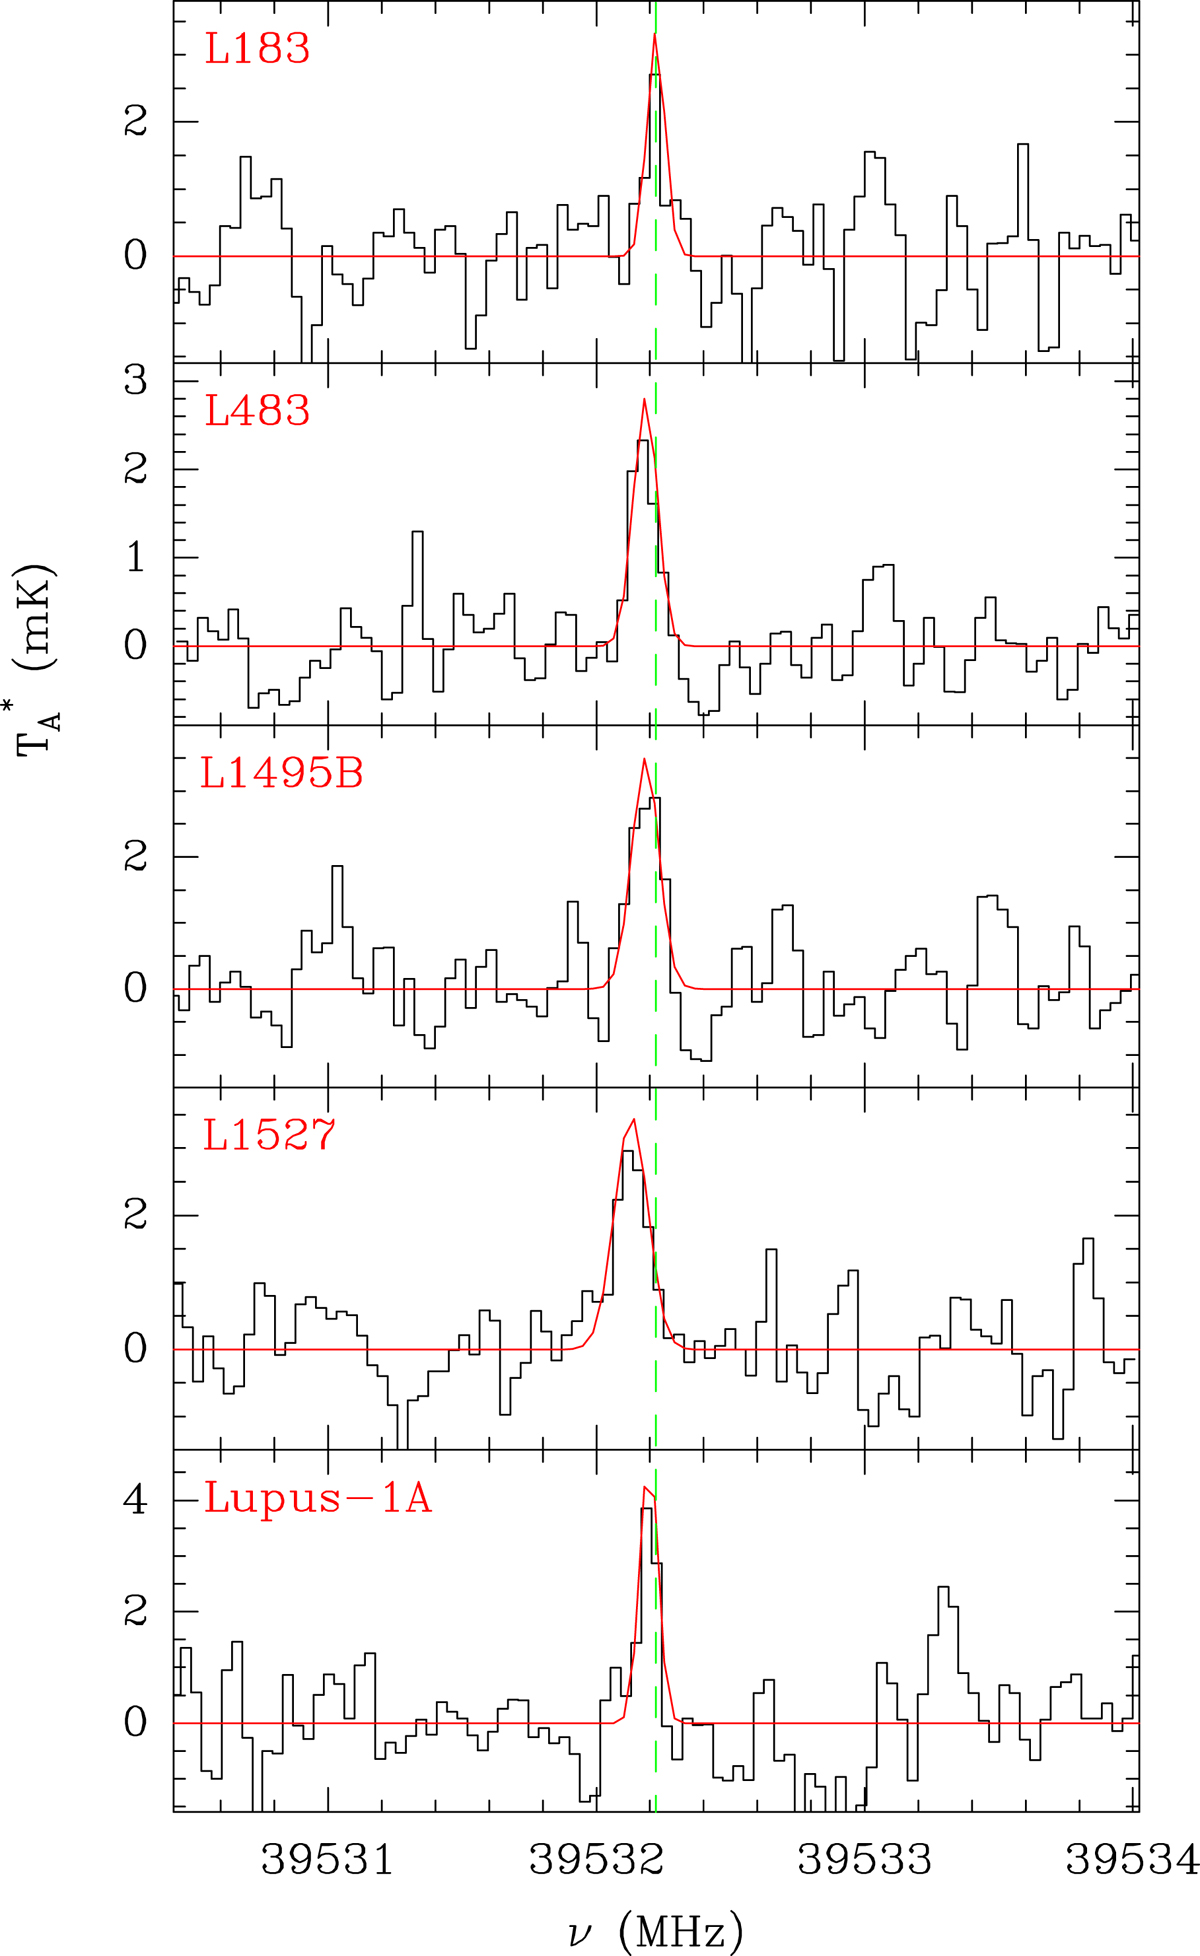
Fig. A.1.

Download original image
HSO N = 10, 1 − 00, 0J = 3/2 − 1/2 F = 2 − 1 transition observed in five cold dense cores with the Yebes 40m telescope. The abscissa corresponds to the rest frequency assuming the local standard of rest velocity for each source (see Table 1). The ordinate is the antenna temperature corrected for atmospheric losses in mK. The red line shows the LTE synthetic spectrum obtained from a fit to the observed line profiles (see text). The green vertical dashed line indicates the new calculated frequency corresponding with this transition. Observed positions for each source are: L183: αJ2000 = 15h54m08.6s and δJ2000 = −02° 52′10.0″, L483: αJ2000 = 18h17m29.83s and δJ2000 = −04° 39′38.33″, L1495B: αJ2000 = 04h15m41.8s and δJ2000 = 28° 47′46.0″, L1527: αJ2000 = 04h39m53.88s and δJ2000 = 26° 03′11.0″, and Lupus-1A: αJ2000 = 15h42m52.4s and δJ2000 = −34° 07′53.5″.
Current usage metrics show cumulative count of Article Views (full-text article views including HTML views, PDF and ePub downloads, according to the available data) and Abstracts Views on Vision4Press platform.
Data correspond to usage on the plateform after 2015. The current usage metrics is available 48-96 hours after online publication and is updated daily on week days.
Initial download of the metrics may take a while.


