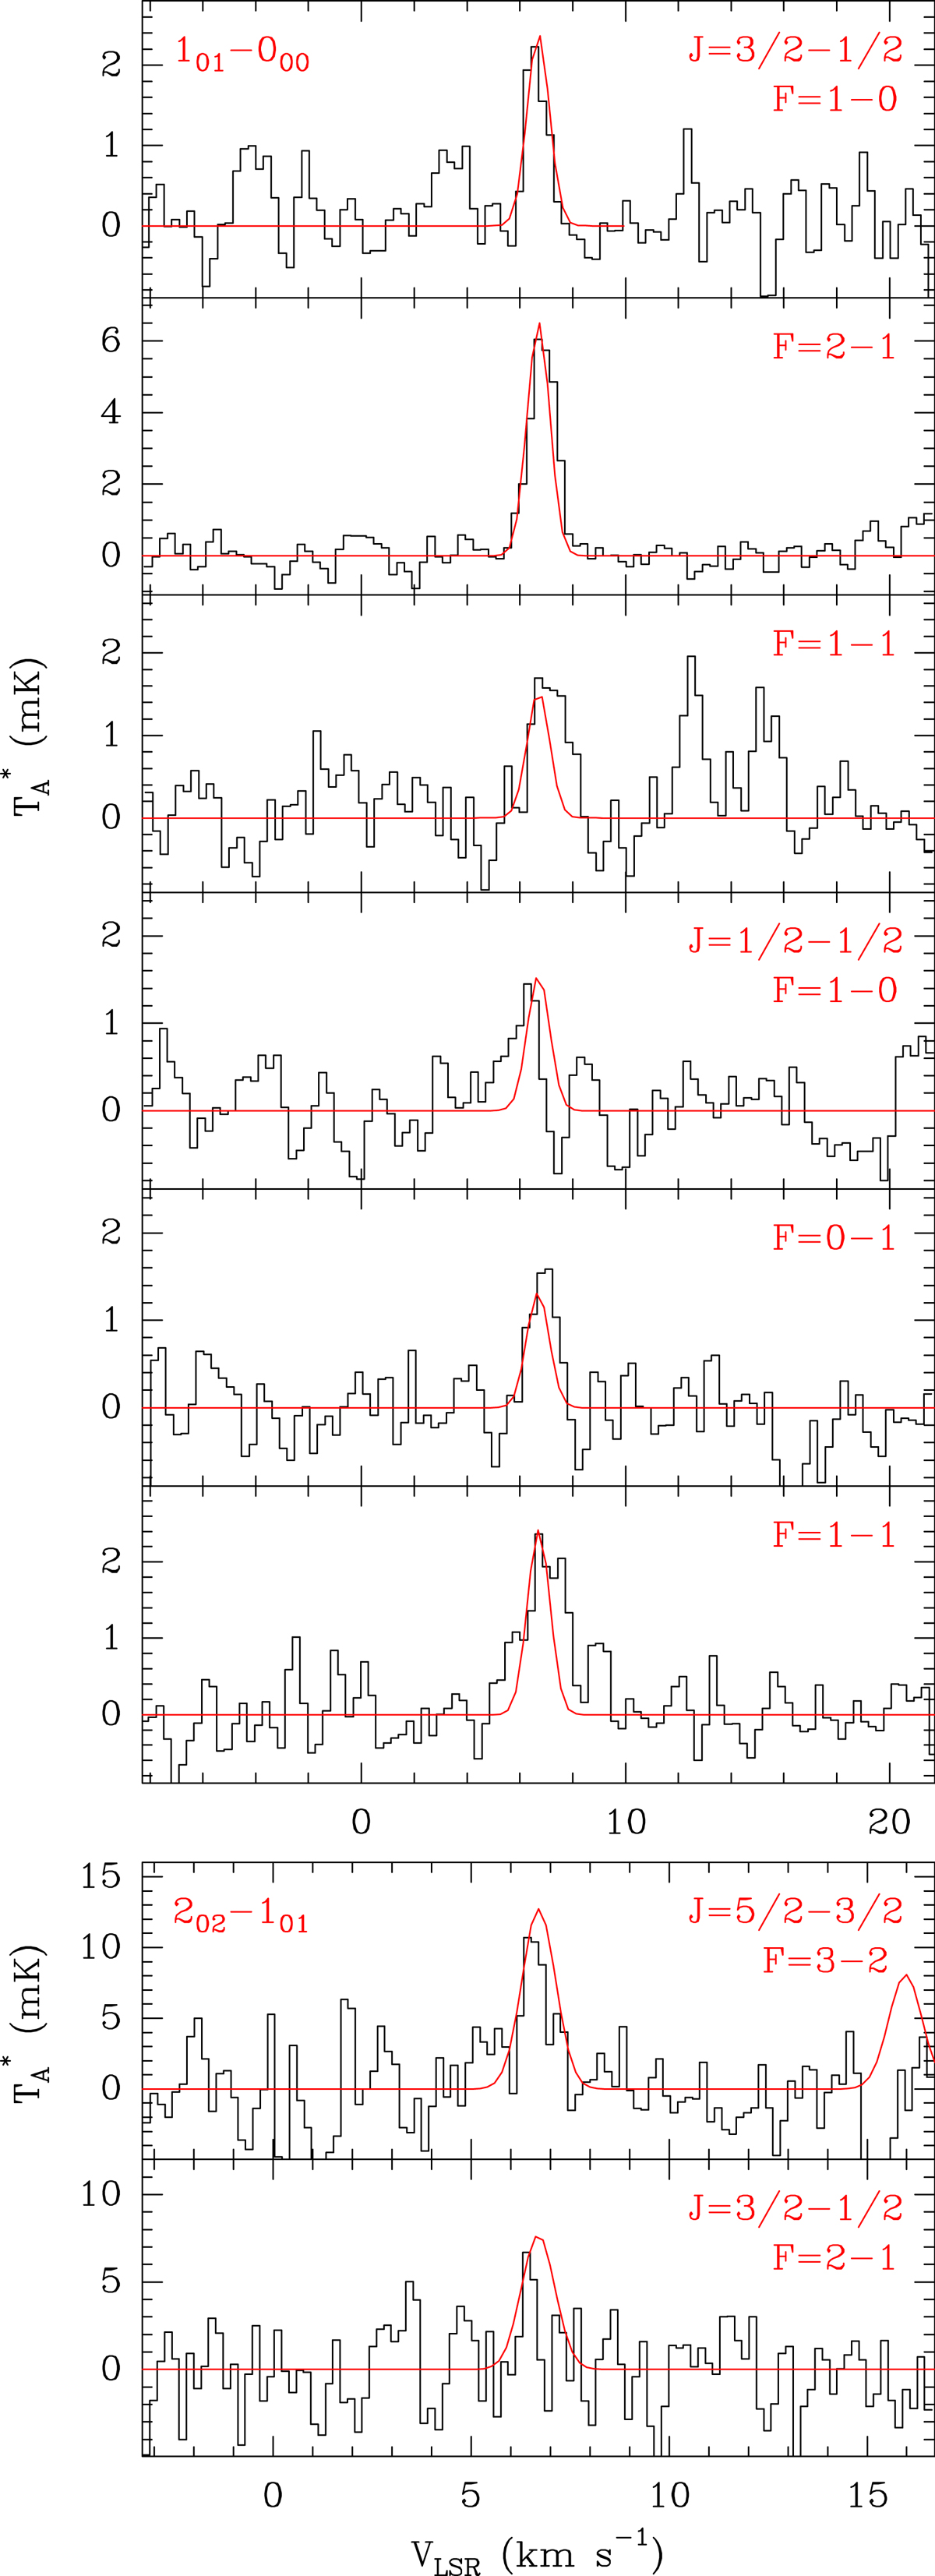
Fig. 1.

Download original image
Observed transitions of HSO toward B1-b with the Yebes 40 m (upper panels) and the IRAM 30 m (bottom panels) telescopes. The red line shows the LTE synthetic spectrum obtained from a fit to the observed line profiles (see text). Note: the 20, 2 − 11, 0, J = 5/2–3/2, F = 2–1 component, shown in the LTE model to the right of the bottom panels, is blended with a negative artifact resulting from the frequency switching observing technique. The observed position in B1-b is αJ2000 = 03h33m20.8s and δJ2000 = 31° 07′34.0″.
Current usage metrics show cumulative count of Article Views (full-text article views including HTML views, PDF and ePub downloads, according to the available data) and Abstracts Views on Vision4Press platform.
Data correspond to usage on the plateform after 2015. The current usage metrics is available 48-96 hours after online publication and is updated daily on week days.
Initial download of the metrics may take a while.


