| Issue |
A&A
Volume 674, June 2023
|
|
|---|---|---|
| Article Number | L7 | |
| Number of page(s) | 5 | |
| Section | Letters to the Editor | |
| DOI | https://doi.org/10.1051/0004-6361/202346846 | |
| Published online | 09 June 2023 | |
Letter to the Editor
Gas and stellar kinematic misalignment in MaNGA galaxies: What is the origin of counter-rotating gas?
1
Faculty of Physics, Ludwig-Maximilians-Universität, Scheinerstr. 1, 81679 Munich, Germany
2
Main Astronomical Observatory, National Academy of Sciences of Ukraine, 27 Akademika Zabolotnoho St., 03143 Kyiv, Ukraine
e-mail: This email address is being protected from spambots. You need JavaScript enabled to view it.
Received:
8
May
2023
Accepted:
20
May
2023
Abstract
Context. Kinematic misalignment between gas and stellar components is observed in a certain fraction of galaxies. It believed to be caused by the acquisition of gas from the external reservoir by, for example, major or minor mergers, accretion from cosmological filaments, or the circumgalactic medium.
Aims. We aim to constrain the possible sources of the gas that forms the counter-rotating component.
Methods. We derived the gas-phase oxygen abundances of 69 galaxies with a kinematic misalignment between gas and stellar components from the MaNGA DR17 survey and compared them with the metallicity expected according to the mass–metallicity relation.
Results. We find that the oxygen abundance of the counter-rotating gas in our sample is higher than 8.2 dex, which rules out a significant role for the inflow of pristine gas. Meanwhile, there is a significant difference in the oxygen abundance of the counter-rotating gas between red and blue galaxies. In general, the oxygen abundance is lower than expected for the stellar mass in red galaxies but is compatible with or even higher than typical values for the stellar mass in blue galaxies.
Conclusions. We show that the exchange of enriched gas between galaxies is the most plausible mechanism for explaining the metallicity of counter-rotating gas components in galaxies of all masses and colors. Meanwhile, minor mergers may play a significant role in the formation of counter-rotating gas components in red and quenched galaxies.
Key words: ISM: abundances / galaxies: evolution / HII regions / galaxies: kinematics and dynamics
© The Authors 2023
 Open Access article, published by EDP Sciences, under the terms of the Creative Commons Attribution License (https://creativecommons.org/licenses/by/4.0), which permits unrestricted use, distribution, and reproduction in any medium, provided the original work is properly cited.
This article is published in open access under the Subscribe to Open model. This email address is being protected from spambots. You need JavaScript enabled to view it. to support open access publication.
1. Introduction
The study of galaxy kinematics has revealed the occurrence of counter-rotating components within certain galaxies. These components exhibit a rotational direction that is opposite to that of the galaxy’s main body. This peculiar kinematic misalignment has been observed between stellar components (Rubin et al. 1992; Rix et al. 1992; Bertola et al. 1996; Coccato et al. 2011; Johnston et al. 2013; Krajnović et al. 2015) as well as between gaseous and stellar components (Bettoni 1984; Galletta 1987; Ciri et al. 1995; Davis et al. 2011; Chung et al. 2012; Pizzella et al. 2018).
A number of mechanisms have been suggested to explain the kinematic misalignment observed in galaxy components, starting with the hypothesis of a purely internal redistribution of matter within the disk and bulge. These scenarios include resonance capturing (Tremaine & Yu 2000), dissolving bars (Evans & Collett 1994), and angular momentum exchange with a bar (Pfenniger & Friedli 1991). While these mechanisms offer potential explanations, they struggle to account for the significant differences in ages and metallicities observed in the stellar components (Pizzella et al. 2014; Nedelchev et al. 2019).
Another class of scenario that has been theoretically proposed to explain the formation of counter-rotating components involves the acquisition of gas with retrograde rotation from regions outside the galactic disk. These scenarios include: (i) major mergers of galaxies (Puerari & Pfenniger 2001; ii) gas-rich minor mergers (Thakar & Ryden 1998; Bassett et al. 2017); and (iii) gas accretion from cosmological filaments or the gas-rich circumgalactic medium (Algorry et al. 2014; Khoperskov et al. 2021). These scenarios find support in a number of observations that favor either mergers with gas-rich galaxies (Thakar et al. 1997; Di Matteo et al. 2008; Saburova et al. 2018) or retrograde gas accretion (Thakar & Ryden 1998; Chung et al. 2012; Nedelchev et al. 2019; Osman & Bekki 2017; Pizzella et al. 2018; Bevacqua et al. 2022). Despite these proposed scenarios, the origin of the gas that forms counter-rotating components in galaxies and its relation to various processes, such as gas accretion, interaction with other galaxies, stellar and active galactic nucleus feedback, and other effects, remains unclear.
In this work we aim to study the origin of the gaseous counter-rotation component at z ∼ 0 using the Mapping Nearby Galaxies at APO (MaNGA) sample of galaxies. Specifically, we investigate the chemical abundance of the counter-rotating gas, which may help in distinguishing between pristine gas and enriched gas, providing valuable insights into the formation mechanisms involved.
The paper is structured as follows. In Sect. 2 we provide a detailed description of the data used and the criteria employed for sample selection. Section 3 describes the stellar mass, color, and gas-phase metallicity of galaxies with counter-rotation. In Sect. 4 we discuss potential scenarios for the formation of counter-rotating gaseous components. Finally, Sect. 5 presents a summary of the main findings.
2. Sample selection
In this study we used a sample of galaxies obtained from the MaNGA Data Release (DR) 17 survey (Abdurro’uf 2022). To derive chemical and kinematic properties, we analysed the MaNGA spectra following prescriptions described in Zinchenko et al. (2016, 2021). In brief, the stellar component in all spaxels was fitted using the public version of the STARLIGHT code (Cid Fernandes et al. 2005; Mateus et al. 2006; Asari et al. 2007) adapted for the parallel processing of datacubes. To fit the stellar spectra, we used simple stellar population (SSP) spectra from the evolutionary synthesis models from Bruzual & Charlot (2003). The best fit of the stellar spectrum was used to obtain the line-of-sight stellar velocity. Also, it was subtracted from the observed spectrum to obtain a pure gas spectrum.
To fit the emission lines, we used our code ELF3D for emission line fitting in the optical spectra. The code is built upon the LMFIT package (Newville et al. 2014), which offers a high-level interface for nonlinear optimization and curve fitting problems. For each spectrum, we measured the fluxes of several emission lines, including [O II]λ λ3727,3729, Hβ, [O III]λ4959, [O III]λ5007, [N II]λ6548, Hα, [N II]λ6584, and [S II]λ6717,6731. To account for interstellar reddening, we applied the analytical approximation of the Whitford interstellar reddening law (Izotov et al. 1994), assuming a Balmer line ratio of Hα/Hβ = 2.86. In cases where the measured value of Hα/Hβ was less than 2.86, we set the reddening to zero.
Next, we used the Hα emission line to construct the gas velocity field and compared it with the stellar velocity field obtained from the SSP fitting. Visual inspection of the velocity fields in all datacubes allowed us to select galaxies exhibiting a clear rotation pattern in both the stellar and gaseous components. Specifically, we selected galaxies whose gaseous and stellar components were either counter-rotating or exhibited significant kinematic misalignment, where the difference in position angle (PA) is around or greater than 90°.
To further refine our sample, we considered only galaxies that contain star-forming regions within the effective radius (Re), enabling us to derive oxygen abundances using strong line methods. To identify spaxels associated with H II regions, we applied the log([O III]λ5007/Hβ) – log([N II]λ6584/Hα) diagram (Baldwin et al. 1981) and utilized the dividing line proposed by Kauffmann et al. (2003).
For the derivation of oxygen abundances, we selected only spectra with a signal-to-noise ratio (S/N) > 4 in all the [O II]λ, λ3727,3729, Hβ, [O III]λ5007, Hα, and [N II]λ6584, [S II]λ6717,6731 lines. We applied the empirical R calibration (Pilyugin & Grebel 2016) to obtain the oxygen abundance. Importantly, this calibration is effective across the entire metallicity range, including the low-metallicity regime expected in cases of gas accretion from cosmological filaments or low-metallicity dwarfs. Given the potential variation in metallicity with galactocentric radius, we derived the oxygen abundance in two radial bins: R < 0.5Re and 0.5Re < R < Re. However, the oxygen abundance measurements in both these bins are only available for a subset of galaxies, and we found no significant radial abundance gradient in those cases. Henceforth, we refer to the average oxygen abundance within the Re. We only considered galaxies with a minimum of five star-forming spaxels within this radius. Consequently, our final sample comprises 69 galaxies.
The stellar masses, effective radii, and colors of the MaNGA sample were obtained from the NASA-Sloan Atlas (NSA) catalog1. We adopted NSA stellar masses derived by fitting the elliptical Petrosian fluxes using the K-correction method, assuming the Chabrier (2003) initial mass function and utilizing SSP models from Bruzual & Charlot (2003). The adopted Re is defined as the Sersic 50% light radius along the major axis in the r band. The inclination and PA of the major axis of the galaxies were obtained from the Sersic fit to the surface brightness profile in the r band.
3. Stellar mass, color, and metallicity
In order to assess the distribution of our sample of galaxies with kinematic misalignment in terms of stellar mass and type, we employed the color–stellar mass diagram. As illustrated in Fig. 1, the majority of galaxies exhibit a high u − r color, indicating a quenched or "red and dead" state. Only a small fraction of galaxies in our sample show signs of global and continuous star formation, as they reside in the blue cloud region and have low u − r values. Notably, there is a relatively high fraction of galaxies from our sample located in the green valley compared to the total number of MaNGA galaxies in that region. Additionally, it is worth mentioning that nearly all the galaxies with kinematic misalignment found in the green valley have a stellar mass of log(M/M⊙)∼10.0 or lower.
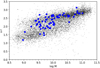 |
Fig. 1. Galaxy color–stellar mass diagram. Gray points represent the full sample of MaNGA galaxies. Blue squares are galaxies from our sample. |
The predominance of red galaxies in our sample supports the hypothesis that the kinematically misaligned gas originated from outside the galaxy. However, this observation does not provide a conclusive distinction between merging events and the infall of extragalactic gas.
To further investigate the nature of the gas in the counter-rotating galaxies, we examined the stellar mass–metallicity diagram. It has been widely observed that galaxies follow a tight correlation on the stellar mass–metallicity diagram, with more massive galaxies generally exhibiting higher metallicities (Andrews & Martini 2013; Zinchenko et al. 2019, 2021). Therefore, the stellar mass of a galaxy with a counter-rotating gaseous disk reflects the host galaxy’s properties, while the gas-phase metallicity reflects the history of the merging or accreting counter-rotating component. For instance, intergalactic gas within cosmological filaments is expected to retain its primordial chemical abundance. Therefore, galaxies that accreted gas from the cosmological filament or another galaxy with a different mass are expected to be outliers on the stellar mass–metallicity diagram.
In Fig. 2 we present the stellar mass–metallicity diagram for our sample of galaxies (color-coded symbols), in comparison to the overall MaNGA galaxy population (gray points). The u − r color index is usually used in photometric studies to distinguish between quenched red galaxies and star-forming blue galaxies. Here we applied it to our sample of galaxies with kinematic misalignment between the gaseous and stellar components. Notably, none of the counter-rotating galaxies in our sample exhibit very low gas-phase metallicities. The lowest oxygen abundance of 8.21 dex is found in the most massive red galaxy with log(M/M⊙) = 11.01 and u − r = 2.80. The absence of low-metallicity gas suggests that the counter-rotating gas has undergone preprocessing through star formation cycles and is not pristine gas directly accreted from cosmological filaments.
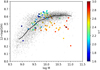 |
Fig. 2. Mass–metallicity diagram. Gray points represent the sample of MaNGA galaxies for which the oxygen abundance can be derived within Re. Colored circles are galaxies from our sample with u − r. The solid black line represents the median oxygen abundance in mass bins. |
Another intriguing feature seen in this plot is that not all galaxies in our sample deviate significantly from the average mass–metallicity relation. In fact, blue star-forming galaxies and those in the green valley (u − r < 2.4) exhibit similar or even higher gas-phase oxygen abundances compared to other galaxies of similar stellar masses. On the contrary, red galaxies with counter-rotating gaseous components demonstrate significantly lower gas-phase oxygen abundances relative to other galaxies of similar stellar masses.
Therefore, our sample of galaxies with kinematic misalignment between the gaseous and stellar components can be divided into two distinct subgroups with different behaviors on the mass–metallicity diagram. The primary distinction between these subgroups lies in their color and, consequently, their past star formation rates. This finding provides additional constraints on the potential mechanisms responsible for the formation of counter-rotating components in galaxies.
4. Discussion
4.1. The environment
Based on the study of counter-rotating stellar disks in 64 galaxies from MaNGA DR16, Bevacqua et al. (2022) suggest that the formation of counter-rotating components in galaxies is likely influenced by the environment. Specifically, mergers and interactions may be the main causes of counter-rotating components in galaxies in dense environments, while in low-density environments, undisturbed gas accretion, for example from cosmological filaments, may be more dominant in the formation of counter-rotating disks. Additionally, Beom et al. (2022) find that counter-rotating galaxies in MaNGA are preferentially found in small groups.
According to the Galaxy Environment for MaNGA Value Added Catalog (GEMA-VAC), approximately 45% of the galaxies in our sample belong to pairs or groups. However, this value may be a lower limit because a visual inspection of the images of our galaxy sample taken by SDSS and Legacy surveys revealed the presence of tidal features or potential dwarf satellites for some galaxies classified as isolated in the GEMA-VAC catalog. We did not find a correlation between the oxygen abundance and membership in a pair or group, according to the GEMA-VAC catalog, except for the fact that the majority of massive galaxies are classified as members of pairs or groups. However, it is noteworthy that all massive galaxies in our sample exhibit lower oxygen abundances.
The significant number of galaxies in groups and/or exhibiting tidal features in our sample may suggest that the exchange of enriched gas between galaxies in groups, as observed between host galaxies and their satellites in Schaefer et al. (2019), could also contribute to the development of the kinematic misalignment in the gas component. Overall, these results confirm that the environment may play an important role in the formation of counter-rotating gas components.
4.2. Example of an interacting system
Along with the several galaxies in our sample that exhibit tidal features (∼25%), we have identified one pair of galaxies that is likely undergoing an exchange of baryonic matter. The more massive galaxy in this pair, VII Zw 720, is a quenched galaxy with a stellar mass of log(M/M⊙) = 10.02, u − r = 2.61, and a counter-rotating gas component. The other galaxy, SDSS J173202.96+595854.7, is located 47 arcseconds to the northeast of VII Zw 720 and exhibits a wide-open spiral arm pointing toward VII Zw 720, as illustrated in Fig. 3. Fortunately, the center of SDSS J173202.96+595854.7 has an available SDSS spectrum with a measured redshift, z = 0.02914, that is remarkably close to the redshift of VII Zw 720 (z = 0.02920). These facts suggest that these galaxies are most likely interacting and dynamically connected.
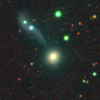 |
Fig. 3. Color composite image of VII Zw 720 and SDSS J173202.96+595854.7 made using three optical bands (g, r, and z) taken from the Legacy Survey DR10 sky map. |
According to the NSA catalog, SDSS J173202.96+595854.7 has a stellar mass of log(M/M⊙) = 9.05 and a u − r = 1.68. The SDSS spectrum obtained for its center enables us to derive the oxygen abundance in this galaxy. Analyzing the emission line ratios on the Baldwin-Phillips-Terlevich diagram, we find that the spectrum falls within the composite region, although very close to the demarcation line between composite and Seyfert spectra proposed by Kewley et al. (2001). Consequently, we adopted the oxygen abundance calibration for Seyferts developed by Dors (2021). The resulting oxygen abundances for the two galaxies are remarkably similar, 8.49 dex for SDSS J173202.96+595854.7 and 8.47 dex for VII Zw 720.
It should be noted that both galaxies appear as outliers on the mass–metallicity diagram. VII Zw 720 has a higher stellar mass than expected at its metallicity, while SDSS J173202.96+595854.7 has a lower stellar mass than expected based on the mass–metallicity relation. This suggests that the more massive and redder galaxy, VII Zw 720, may be accreting gas from its less massive but more gas-rich companion. During this process, the low-mass galaxy could experience tidal disruption, leading to the loss of a fraction of its stellar mass and shifting the galaxy to an outlier region above the averaged mass–metallicity relation. Simultaneously, the acquisition of lower-metallicity gas from the companion shifts VII Zw 720 below the averaged mass–metallicity relation. Considering the current difference in stellar mass between these galaxies is approximately tenfold, this scenario could indicate the early stages of a minor merger event that is leading to the formation of a counter-rotating gas component. Thus, minor mergers involving gas-rich galaxies may represent one of the primary mechanisms contributing to the formation of counter-rotating gas components, particularly in massive and quenched galaxies.
4.3. Counter-rotating components of high metallicity
Although the minor merger scenario provides a plausible explanation for the metallicity of the counter-rotating gas component in red galaxies, it becomes challenging to account for the origin of counter-rotating gas components in star-forming galaxies with low u − r colors using minor mergers. In Fig. 2, galaxies with low u − r generally follow the averaged mass–metallicity relation or even exceed the average metallicity for their respective stellar masses.
Despite the stellar components that are collisionless, a configuration with two counter-rotating gas components is unstable, and one of the gas components will quickly dissolve (see, e.g., Khoperskov et al. 2021). Hence, for the formation of a counter-rotating gas component, the angular momentum of the merging gas component must exceed that of the corotating gas. Consequently, the mass and, therefore, metallicity of the merging gas should dominate in the newly formed counter-rotating gas component (Bassett et al. 2017). This sets a lower limit on the amount of gas (and the minor-merger mass ratio) required to form a counter-rotating component in the presence of corotating gas in the host galaxy. However, defining an exact limit is challenging since, even in the simpler case of a stellar merger without a gas component, the final configuration is dependent on orbit parameters and the mass ratio involved (Zinchenko et al. 2015).
Additionally, the mass–metallicity relation implies that when a host galaxy merges with a gas-rich galaxy of lower mass, the resulting host galaxy will exhibit a lower metallicity. Therefore, in the case of a minor merger, the counter-rotating gas component, on average, should have a lower metallicity than expected for the host galaxy’s mass. Yet, a major merger can produce counter-rotating gas components with metallicities consistent with the average mass–metallicity relation.
However, a major merger scenario should also produce two counter-rotating stellar components with comparable masses. To investigate this aspect within our sample of counter-rotating galaxies, we compared our sample with the one from Bevacqua et al. (2022), who identified 64 galaxies with counter-rotating stellar disks among the 4000 galaxies from MaNGA DR16. Interestingly, we found only five galaxies that appear in both samples, meaning they possess both counter-rotating gaseous and stellar components simultaneously. Among these five galaxies, four exhibit low u − r colors and oxygen abundances higher than the average value for their respective stellar masses. However, it remains unclear whether the counter-rotating stellar component was formed in situ from counter-rotating gas or was acquired from another galaxy during the merging process. Thus, while major mergers represent a potential channel for the formation of counter-rotating gaseous components in star-forming galaxies, they do not seem to be the dominant mechanism.
In addition to the mechanisms discussed earlier, the exchange of enriched gas between galaxies in groups or clusters, as suggested by Schaefer et al. (2019), can also contribute to the formation of counter-rotating gas components. Figure 2 shows that the oxygen abundance of the counter-rotating gas component in galaxies within the intermediate stellar mass range of log(M/M⊙)∼10.0 varies from approximately 8.35 dex to 8.7 dex. Furthermore, there is a correlation between oxygen abundance and color, where red galaxies exhibit lower oxygen abundances compared to blue galaxies. The exchange of enriched gas between galaxies can explain the existence of counter-rotating gas with both higher and lower metallicities compared to the average metallicity for a given galaxy mass, depending on the metallicity of the galaxy from which the gas originated.
Quenched and red galaxies without a significant corotating gas disk may require the infall of a relatively small amount of counter-rotating gas to form a counter-rotating gas component. This gas could originate from the feedback of a low-mass galaxy with low metallicity. On the other hand, star-forming and blue galaxies already possess a corotating gaseous disk and would require a larger amount of counter-rotating gas to reverse the rotation of the gas component. In such cases, the amount of gas ejected from a low-mass galaxy may be insufficient to replace the existing corotating gaseous disk. Instead, the formation of a counter-rotating gas component would necessitate the accretion of a significant amount of gas potentially provided by another galaxy of a similar or higher mass. Particularly, high-metallicity galaxies in our sample with oxygen abundances above 8.6 dex in the mass range 9.7 < log(M/M⊙) < 10.4 may inherit their high-metallicity gas through feedback from more massive galaxies, for which such a high metallicity is typical.
The transfer of enriched gas from one galaxy to another, where it may form a counter-rotating disk, can be facilitated by various physical mechanisms. These include stellar and active galactic nucleus feedback (van de Voort et al. 2016; Hafen et al. 2019; Choi et al. 2020; Li et al. 2023) as well as ram pressure stripping of gas in galaxy clusters (Gullieuszik et al. 2023; George et al. 2023).
5. Summary and conclusions
We have identified counter-rotating gas components that contain H II regions in 69 galaxies from the MaNGA DR17 survey. To gain insights into the origin of this counter-rotating gas, we conducted a comparative analysis involving the stellar mass of the galaxy, its color index (u − r), and the oxygen abundance of the counter-rotating gas. Our analysis aimed to provide constraints on the origin of the counter-rotating gas components. Our main conclusions are the following:
-
The oxygen abundance of the counter-rotating gas components in our sample is higher than 8.2 dex, suggesting that a direct inflow of pristine gas from cosmological filaments is an unlikely source of gas acquisition for galaxies in the current epoch, especially for the formation of counter-rotating gas components.
-
The majority of galaxies with a counter-rotating gas component in our sample are either red and quenched or lie in the green valley on the stellar mass–color diagram.
-
There is a significant difference in the oxygen abundance of the counter-rotating gas components hosted by red and blue galaxies. In general, the oxygen abundance is lower than expected for the stellar mass in red galaxies, but is compatible with or even higher than typical values for the stellar mass in blue galaxies.
-
Minor mergers may explain the low gas-phase metallicity of red galaxies, but cannot account for the higher metallicity of blue galaxies.
-
Major mergers and/or the exchange of enriched gas between galaxies are able to explain the oxygen abundance of blue galaxies. However, we did not find conclusive evidence for such disruptive events, such as major mergers, in our sample.
Therefore, the exchange of enriched gas between galaxies seems to be the most plausible mechanism for explaining the metallicity of counter-rotating gas components in galaxies of all masses and colors, while minor mergers may play a significant role in the formation of counter-rotating gas components in red and quenched galaxies.
Acknowledgments
We are grateful to the referee for his/her constructive comments. The authors gratefully acknowledge the computational and data resources provided by the Leibniz Supercomputing Centre (https://www.lrz.de/). SDSS-IV acknowledges support and resources from the Center for High-Performance Computing at the University of Utah. The SDSS web site is https://www.sdss.org/. SDSS-IV is managed by the Astrophysical Research Consortium for the Participating Institutions of the SDSS Collaboration including the Brazilian Participation Group, the Carnegie Institution for Science, Carnegie Mellon University, the Chilean Participation Group, the French Participation Group, Harvard-Smithsonian Center for Astrophysics, Instituto de Astrofísica de Canarias, The Johns Hopkins University, Kavli Institute for the Physics and Mathematics of the Universe (IPMU)/University of Tokyo, Lawrence Berkeley National Laboratory, Leibniz Institut für Astrophysik Potsdam (AIP), Max-Planck-Institut für Astronomie (MPIA Heidelberg), Max-Planck-Institut für Astrophysik (MPA Garching), Max-Planck-Institut für Extraterrestrische Physik (MPE), National Astronomical Observatories of China, New Mexico State University, New York University, University of Notre Dame, Observatório Nacional/MCTI, The Ohio State University, Pennsylvania State University, Shanghai Astronomical Observatory, United Kingdom Participation Group, Universidad Nacional Autónoma de México, University of Arizona, University of Colorado Boulder, University of Oxford, University of Portsmouth, University of Utah, University of Virginia, University of Washington, University of Wisconsin, Vanderbilt University, and Yale University.
References
- Abdurro’uf, Accetta K., Aerts, C., et al. 2022, ApJS, 259, 35 [NASA ADS] [CrossRef] [Google Scholar]
- Algorry, D. G., Navarro, J. F., Abadi, M. G., et al. 2014, MNRAS, 437, 3596 [Google Scholar]
- Andrews, B. H., & Martini, P. 2013, ApJ, 765, 140 [NASA ADS] [CrossRef] [Google Scholar]
- Asari, N. V., Cid Fernandes, R., Stasińska, G., et al. 2007, MNRAS, 381, 263 [Google Scholar]
- Baldwin, J. A., Phillips, M. M., & Terlevich, R. 1981, PASP, 93, 5 [Google Scholar]
- Bassett, R., Bekki, K., Cortese, L., & Couch, W. 2017, MNRAS, 471, 1892 [NASA ADS] [CrossRef] [Google Scholar]
- Beom, M., Bizyaev, D., Walterbos, R. A. M., & Chen, Y. 2022, MNRAS, 516, 3175 [CrossRef] [Google Scholar]
- Bertola, F., Cinzano, P., Corsini, E. M., et al. 1996, ApJ, 458, L67 [NASA ADS] [CrossRef] [Google Scholar]
- Bettoni, D. 1984, The Messenger, 37, 17 [NASA ADS] [Google Scholar]
- Bevacqua, D., Cappellari, M., & Pellegrini, S. 2022, MNRAS, 511, 139 [NASA ADS] [CrossRef] [Google Scholar]
- Bruzual, G., & Charlot, S. 2003, MNRAS, 344, 1000 [NASA ADS] [CrossRef] [Google Scholar]
- Chabrier, G. 2003, PASP, 115, 763 [Google Scholar]
- Choi, E., Brennan, R., Somerville, R. S., et al. 2020, ApJ, 904, 8 [NASA ADS] [CrossRef] [Google Scholar]
- Chung, A., Bureau, M., van Gorkom, J. H., & Koribalski, B. 2012, MNRAS, 422, 1083 [Google Scholar]
- Cid Fernandes, R., Mateus, A., Sodré, L., Stasińska, G., & Gomes, J. M. 2005, MNRAS, 358, 363 [Google Scholar]
- Ciri, R., Bettoni, D., & Galletta, G. 1995, Nature, 375, 661 [CrossRef] [Google Scholar]
- Coccato, L., Morelli, L., Corsini, E. M., et al. 2011, MNRAS, 412, L113 [NASA ADS] [CrossRef] [Google Scholar]
- Davis, T. A., Alatalo, K., Sarzi, M., et al. 2011, MNRAS, 417, 882 [Google Scholar]
- Di Matteo, P., Combes, F., Melchior, A. L., & Semelin, B. 2008, A&A, 477, 437 [NASA ADS] [CrossRef] [EDP Sciences] [Google Scholar]
- Dors, O. L. 2021, MNRAS, 507, 466 [NASA ADS] [CrossRef] [Google Scholar]
- Evans, N. W., & Collett, J. L. 1994, ApJ, 420, L67 [Google Scholar]
- Galletta, G. 1987, ApJ, 318, 531 [NASA ADS] [CrossRef] [Google Scholar]
- George, K., Poggianti, B. M., Tomičić, N., et al. 2023, MNRAS, 519, 2426 [Google Scholar]
- Gullieuszik, M., Giunchi, E., Poggianti, B. M., et al. 2023, ApJ, 945, 54 [NASA ADS] [CrossRef] [Google Scholar]
- Hafen, Z., Faucher-Giguère, C.-A., Anglés-Alcázar, D., et al. 2019, MNRAS, 488, 1248 [NASA ADS] [CrossRef] [Google Scholar]
- Izotov, Y. I., Thuan, T. X., & Lipovetsky, V. A. 1994, ApJ, 435, 647 [NASA ADS] [CrossRef] [Google Scholar]
- Johnston, E. J., Merrifield, M. R., Aragón-Salamanca, A., & Cappellari, M. 2013, MNRAS, 428, 1296 [Google Scholar]
- Kauffmann, G., Heckman, T. M., Tremonti, C., et al. 2003, MNRAS, 346, 1055 [Google Scholar]
- Kewley, L. J., Dopita, M. A., Sutherland, R. S., Heisler, C. A., & Trevena, J. 2001, ApJ, 556, 121 [Google Scholar]
- Khoperskov, S., Zinchenko, I., Avramov, B., et al. 2021, MNRAS, 500, 3870 [Google Scholar]
- Krajnović, D., Weilbacher, P. M., Urrutia, T., et al. 2015, MNRAS, 452, 2 [Google Scholar]
- Li, A., Fraternali, F., Marasco, A., et al. 2023, MNRAS, 520, 147 [NASA ADS] [CrossRef] [Google Scholar]
- Mateus, A., Sodré, L., Cid Fernandes, R., et al. 2006, MNRAS, 370, 721 [NASA ADS] [CrossRef] [Google Scholar]
- Nedelchev, B., Coccato, L., Corsini, E. M., et al. 2019, A&A, 623, A87 [NASA ADS] [CrossRef] [EDP Sciences] [Google Scholar]
- Newville, M., Stensitzki, T., Allen, D. B., & Ingargiola, A. 2014, LMFIT: Non-Linear Least-Square Minimization and Curve-Fitting for Python (Zenodo) [Google Scholar]
- Osman, O., & Bekki, K. 2017, MNRAS, 471, L87 [NASA ADS] [CrossRef] [Google Scholar]
- Pfenniger, D., & Friedli, D. 1991, A&A, 252, 75 [NASA ADS] [Google Scholar]
- Pilyugin, L. S., & Grebel, E. K. 2016, MNRAS, 457, 3678 [NASA ADS] [CrossRef] [Google Scholar]
- Pizzella, A., Morelli, L., Corsini, E. M., et al. 2014, A&A, 570, A79 [NASA ADS] [CrossRef] [EDP Sciences] [Google Scholar]
- Pizzella, A., Morelli, L., Coccato, L., et al. 2018, A&A, 616, A22 [NASA ADS] [CrossRef] [EDP Sciences] [Google Scholar]
- Puerari, I., & Pfenniger, D. 2001, Ap&SS, 276, 909 [NASA ADS] [CrossRef] [Google Scholar]
- Rix, H.-W., Franx, M., Fisher, D., & Illingworth, G. 1992, ApJ, 400, L5 [NASA ADS] [CrossRef] [Google Scholar]
- Rubin, V. C., Graham, J. A., & Kenney, J. D. P. 1992, ApJ, 394, L9 [NASA ADS] [CrossRef] [Google Scholar]
- Saburova, A. S., Chilingarian, I. V., Katkov, I. Y., et al. 2018, MNRAS, 481, 3534 [CrossRef] [Google Scholar]
- Schaefer, A. L., Tremonti, C., Pace, Z., et al. 2019, ApJ, 884, 156 [Google Scholar]
- Thakar, A. R., & Ryden, B. S. 1998, ApJ, 506, 93 [NASA ADS] [CrossRef] [Google Scholar]
- Thakar, A. R., Ryden, B. S., Jore, K. P., & Broeils, A. H. 1997, ApJ, 479, 702 [NASA ADS] [CrossRef] [Google Scholar]
- Tremaine, S., & Yu, Q. 2000, MNRAS, 319, 1 [Google Scholar]
- van de Voort, F., Quataert, E., Hopkins, P. F., et al. 2016, MNRAS, 463, 4533 [NASA ADS] [CrossRef] [Google Scholar]
- Zinchenko, I. A., Berczik, P., Grebel, E. K., Pilyugin, L. S., & Just, A. 2015, ApJ, 806, 267 [NASA ADS] [CrossRef] [Google Scholar]
- Zinchenko, I. A., Pilyugin, L. S., Grebel, E. K., Sánchez, S. F., & Vílchez, J. M. 2016, MNRAS, 462, 2715 [Google Scholar]
- Zinchenko, I. A., Just, A., Pilyugin, L. S., & Lara-Lopez, M. A. 2019, A&A, 623, A7 [NASA ADS] [CrossRef] [EDP Sciences] [Google Scholar]
- Zinchenko, I. A., Vílchez, J. M., Pérez-Montero, E., et al. 2021, A&A, 655, A58 [NASA ADS] [CrossRef] [EDP Sciences] [Google Scholar]
All Figures
|
Fig. 1. Galaxy color–stellar mass diagram. Gray points represent the full sample of MaNGA galaxies. Blue squares are galaxies from our sample. |
| In the text | |
|
Fig. 2. Mass–metallicity diagram. Gray points represent the sample of MaNGA galaxies for which the oxygen abundance can be derived within Re. Colored circles are galaxies from our sample with u − r. The solid black line represents the median oxygen abundance in mass bins. |
| In the text | |
|
Fig. 3. Color composite image of VII Zw 720 and SDSS J173202.96+595854.7 made using three optical bands (g, r, and z) taken from the Legacy Survey DR10 sky map. |
| In the text | |
Current usage metrics show cumulative count of Article Views (full-text article views including HTML views, PDF and ePub downloads, according to the available data) and Abstracts Views on Vision4Press platform.
Data correspond to usage on the plateform after 2015. The current usage metrics is available 48-96 hours after online publication and is updated daily on week days.
Initial download of the metrics may take a while.