Open Access
Fig. 2.
Download original image
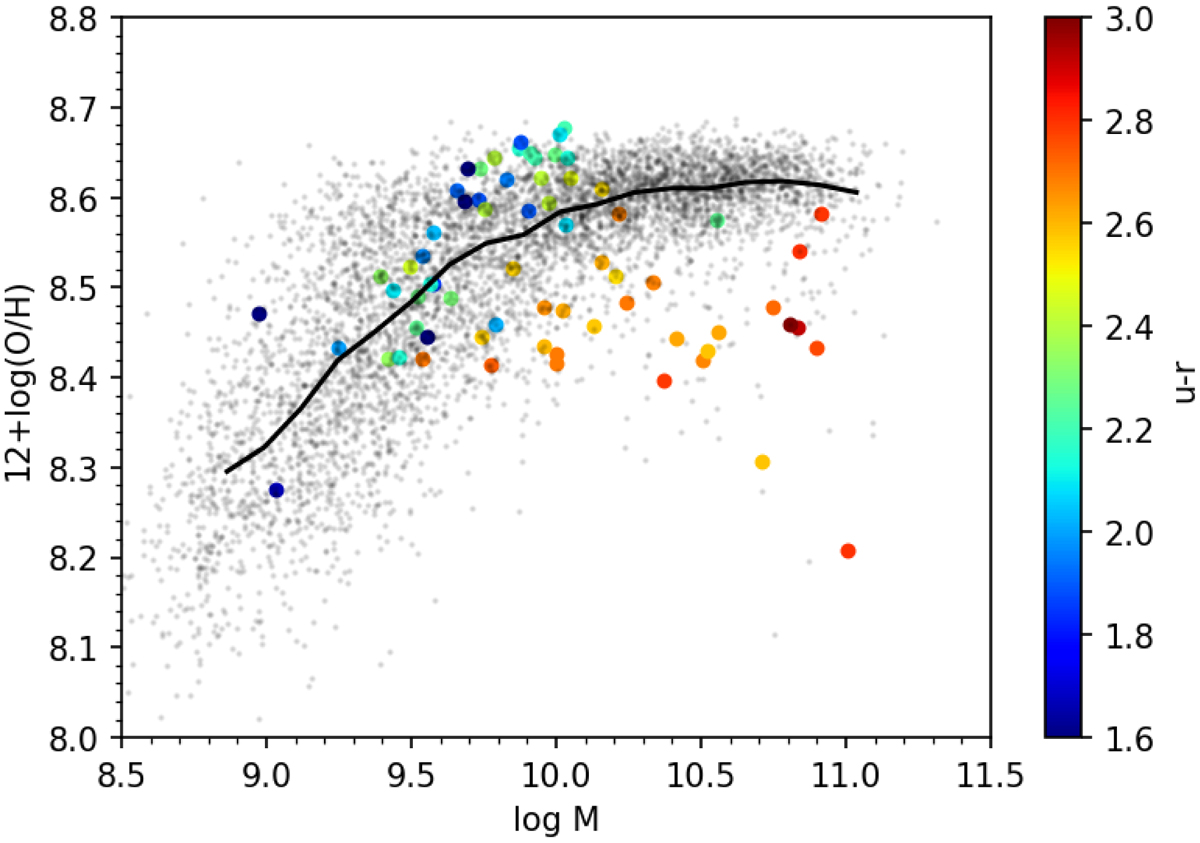
Mass–metallicity diagram. Gray points represent the sample of MaNGA galaxies for which the oxygen abundance can be derived within Re. Colored circles are galaxies from our sample with u − r. The solid black line represents the median oxygen abundance in mass bins.
Current usage metrics show cumulative count of Article Views (full-text article views including HTML views, PDF and ePub downloads, according to the available data) and Abstracts Views on Vision4Press platform.
Data correspond to usage on the plateform after 2015. The current usage metrics is available 48-96 hours after online publication and is updated daily on week days.
Initial download of the metrics may take a while.