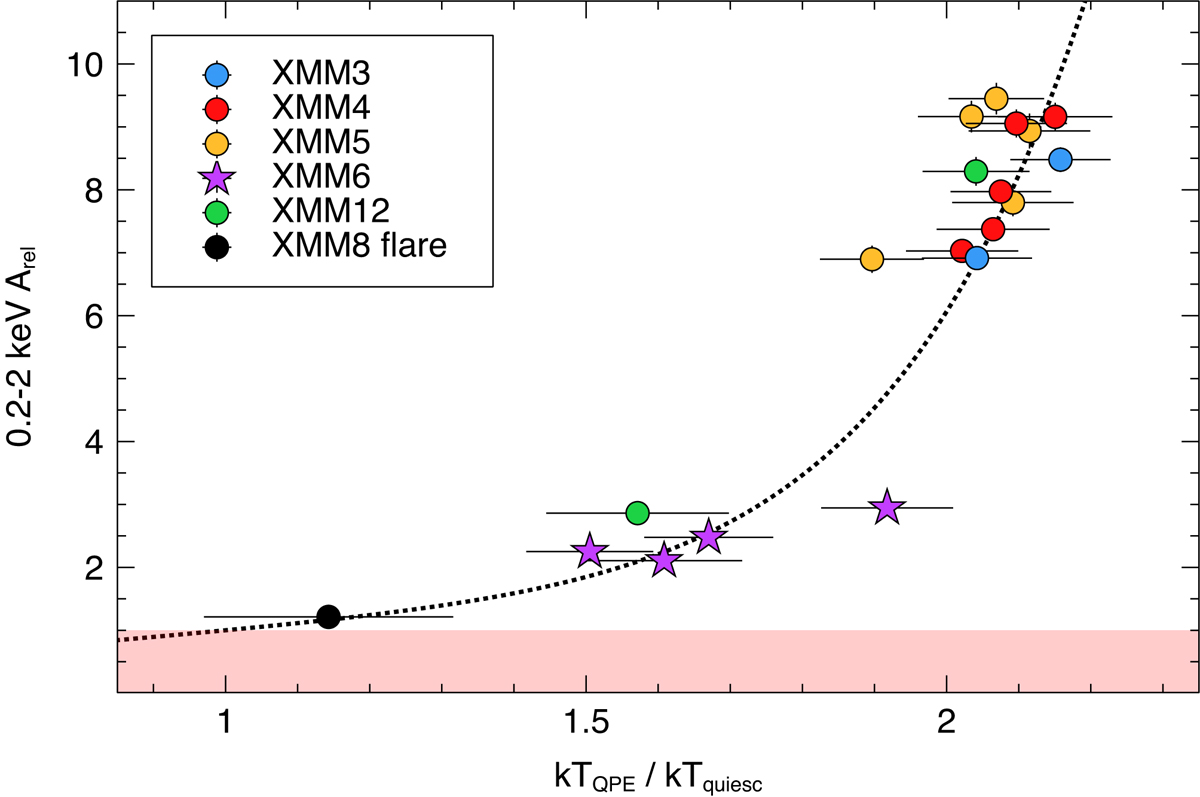
Fig. C.1.
Download original image
Dependence of QPE detection on the eruptions-to-quiescence temperature ratio. The relative 0.2-2 keV QPE amplitude is shown as a function of the ratio of QPE to quiescent temperatures. The horizontal shaded area denotes the region below the QPE detection threshold. Also shown (black data point) is the strongest X-ray flare seen in any observation with no clearly detected QPEs. The dotted line shows a simple fit to the data, whose functional form is chosen so that Arel = 1 when kTQPE/kTquiesc = 1 (see text for details).
Current usage metrics show cumulative count of Article Views (full-text article views including HTML views, PDF and ePub downloads, according to the available data) and Abstracts Views on Vision4Press platform.
Data correspond to usage on the plateform after 2015. The current usage metrics is available 48-96 hours after online publication and is updated daily on week days.
Initial download of the metrics may take a while.