Fig. B.2.
Download original image
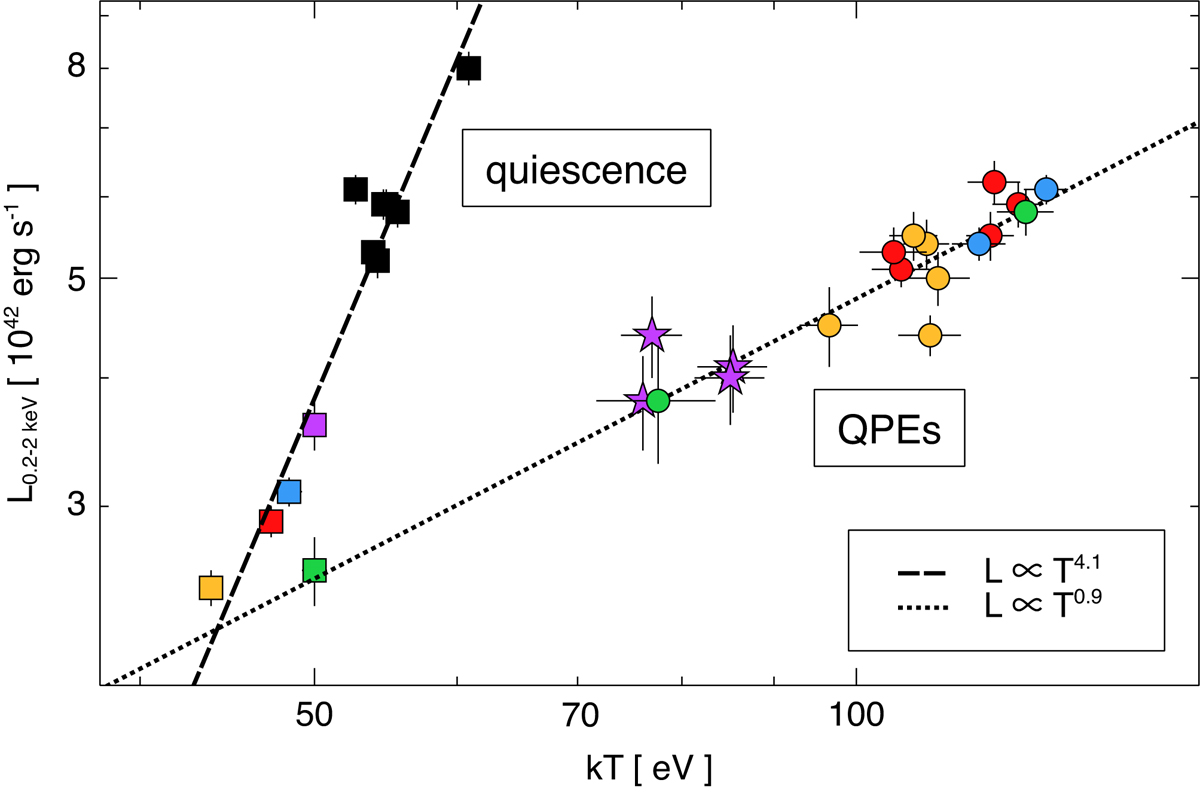
Total QPE and quiescent emission LX-T relation. The 0.2-2 keV X-ray luminosity is shown as a function of rest-frame temperature. The squares denote results from fits to the quiescent spectra only; the circles are from fits to the QPE spectra (not quiescence-subtracted). The same colour scheme as in Fig. B.1 is adopted, and black data points denote observations with no QPEs. All spectra are described using the same absorbed redshifted disc model (diskbb). The dashed (dotted) lines are best-fitting relations for the quiescence (QPEs) of the form LX ∝ Tq resulting in qquiesc ≃ 4.1 and qQPEs ≃ 0.9.
Current usage metrics show cumulative count of Article Views (full-text article views including HTML views, PDF and ePub downloads, according to the available data) and Abstracts Views on Vision4Press platform.
Data correspond to usage on the plateform after 2015. The current usage metrics is available 48-96 hours after online publication and is updated daily on week days.
Initial download of the metrics may take a while.