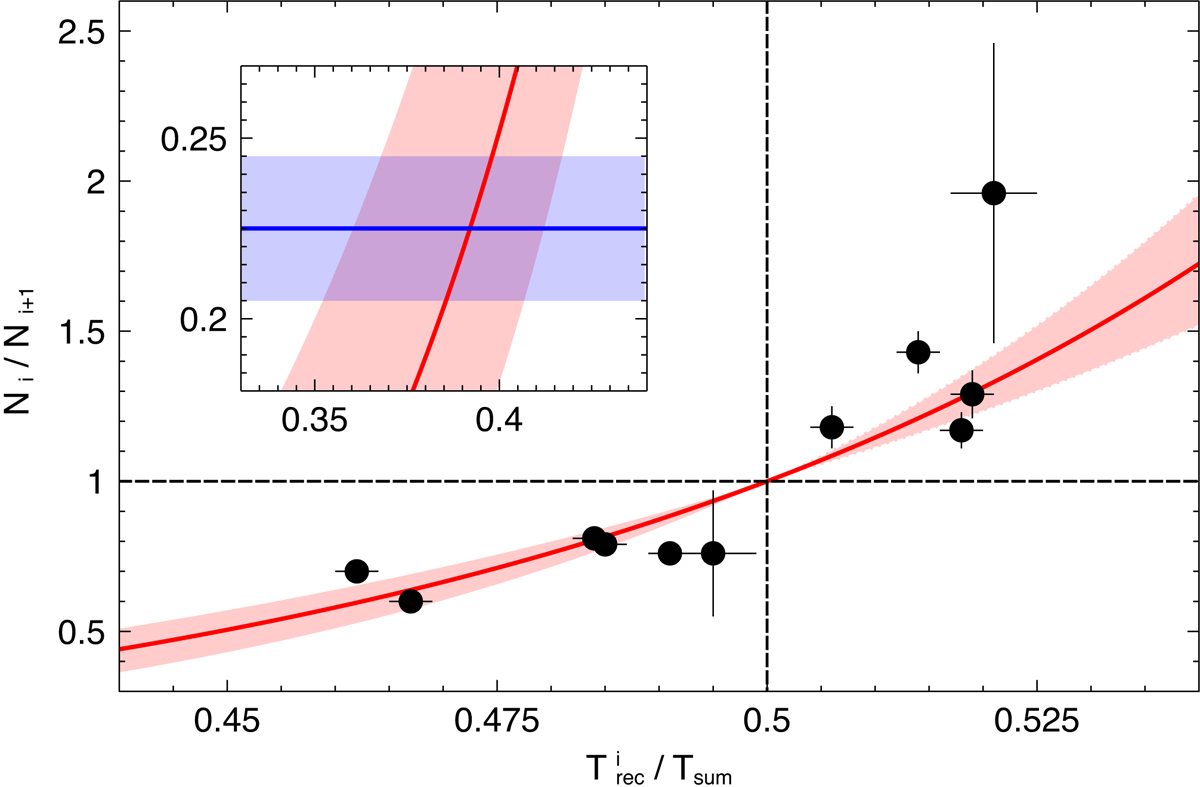
Fig. A.1.
Download original image
QPE intensity-recurrence relation. The ratio between the intensity of consecutive QPEs (in the 0.4-1 keV band) is shown as a function of the recurrence time between them, which is normalised to the average sum of consecutive long and short intervals (i.e. to the average separation between QPEs of the same type). The vertical dotted line separates short recurrence times from long ones, while the horizontal line separates weak-to-strong QPE pairs from strong-to-weak pairs. The best-fitting model is shown as a solid line and the 1σ uncertainty is represented by the shaded area. The inset in the upper left quadrant shows the intersection between the extrapolated model and the intensity ratio of the observed QPEs during XMM12.
Current usage metrics show cumulative count of Article Views (full-text article views including HTML views, PDF and ePub downloads, according to the available data) and Abstracts Views on Vision4Press platform.
Data correspond to usage on the plateform after 2015. The current usage metrics is available 48-96 hours after online publication and is updated daily on week days.
Initial download of the metrics may take a while.