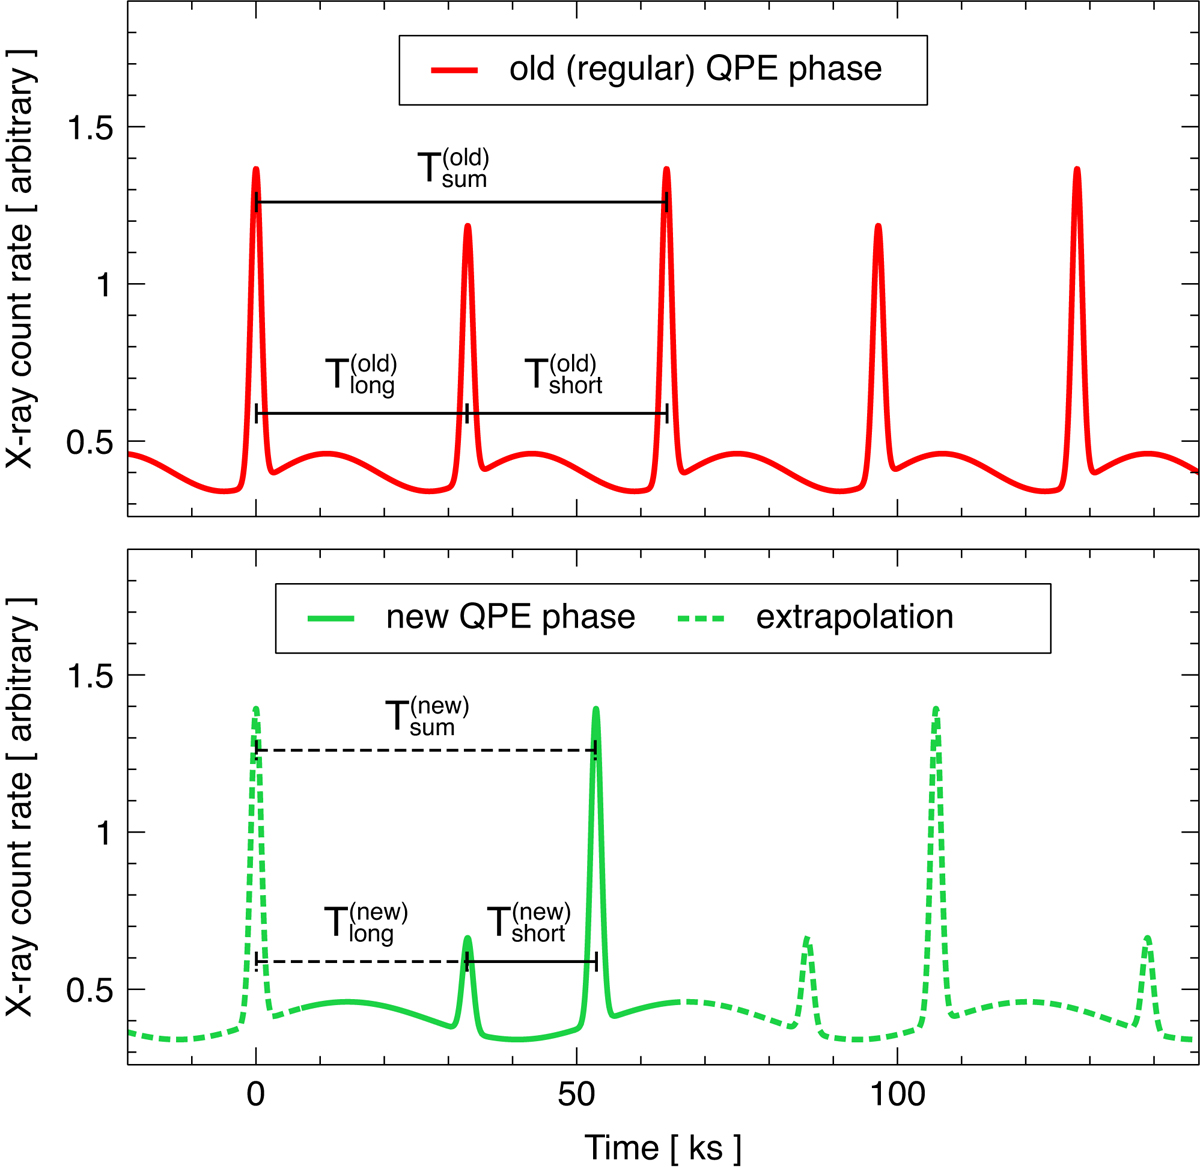
Fig. 3.
Download original image
Comparison between old and new QPE phases. Upper panel: Typical model light curve for observations during the old regular QPE phase. Lower panel: Qualitative representation of the light curve from the XMM12 observation (new QPE phase; solid line) and one possible extrapolation of longer-term behaviour based on the arguments discussed in Sect. 3 and Appendix A (dashed line). The light curves were normalised so that the intensity of the strong QPEs is the same in both panels. The same quiescent level is assumed for visual clarity.
Current usage metrics show cumulative count of Article Views (full-text article views including HTML views, PDF and ePub downloads, according to the available data) and Abstracts Views on Vision4Press platform.
Data correspond to usage on the plateform after 2015. The current usage metrics is available 48-96 hours after online publication and is updated daily on week days.
Initial download of the metrics may take a while.