Fig. 2.
Download original image
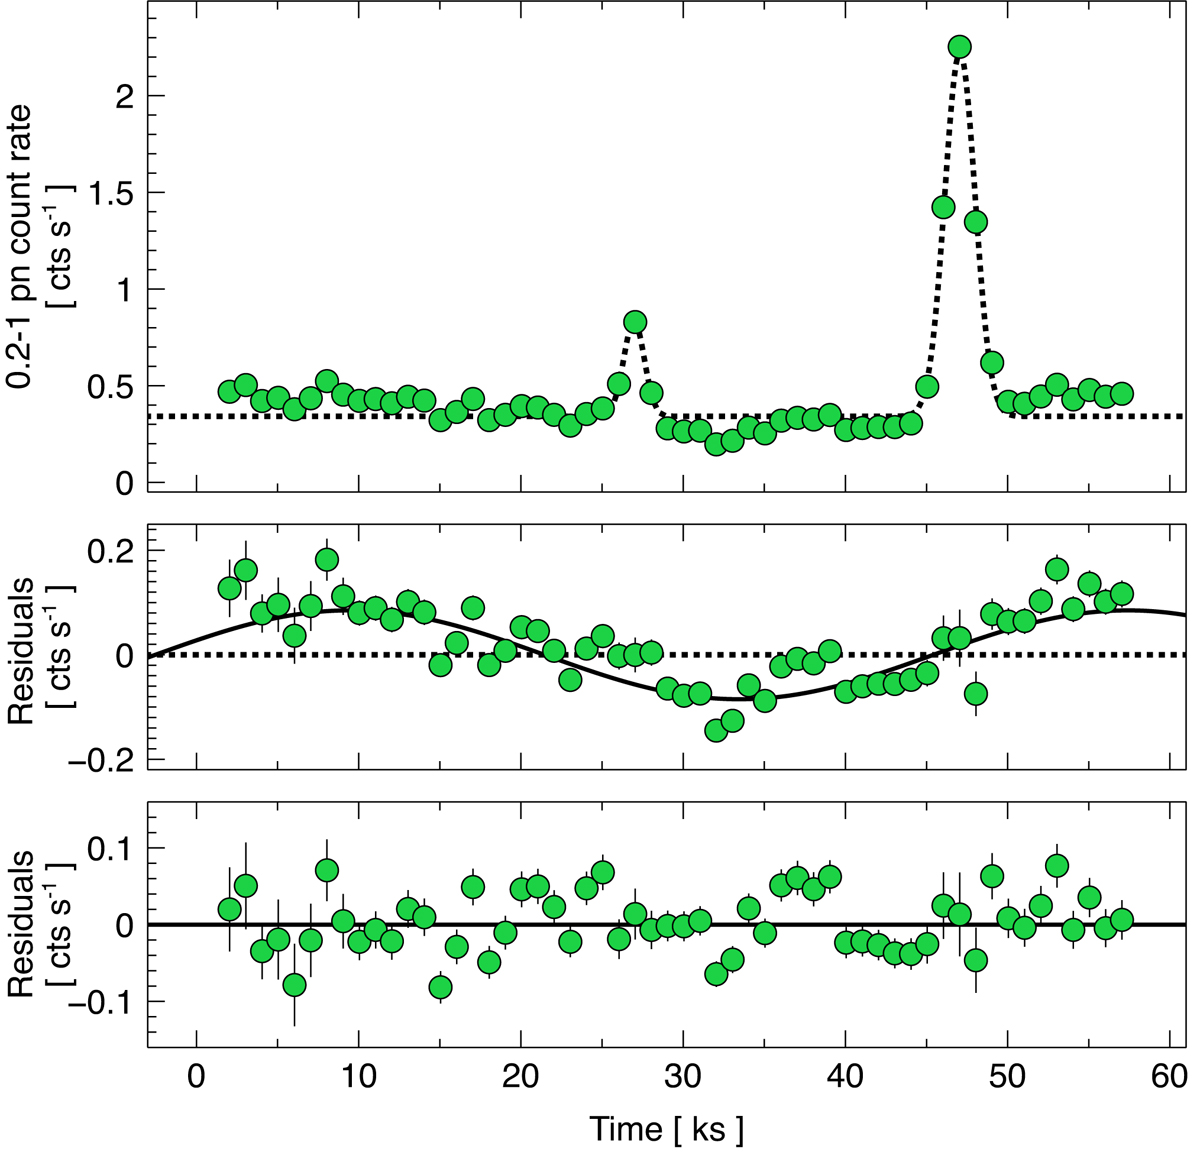
Quiescent level QPO. Upper panel: 0.2–1 keV pn light curve with time bins of 1000 s, together with its baseline best-fitting model. Middle panel: Resulting residuals and, as a solid line, a sine function that is plotted to guide the eye. Lower panel: Residuals once the original light curve is fitted by adding a sine function to the baseline model.
Current usage metrics show cumulative count of Article Views (full-text article views including HTML views, PDF and ePub downloads, according to the available data) and Abstracts Views on Vision4Press platform.
Data correspond to usage on the plateform after 2015. The current usage metrics is available 48-96 hours after online publication and is updated daily on week days.
Initial download of the metrics may take a while.