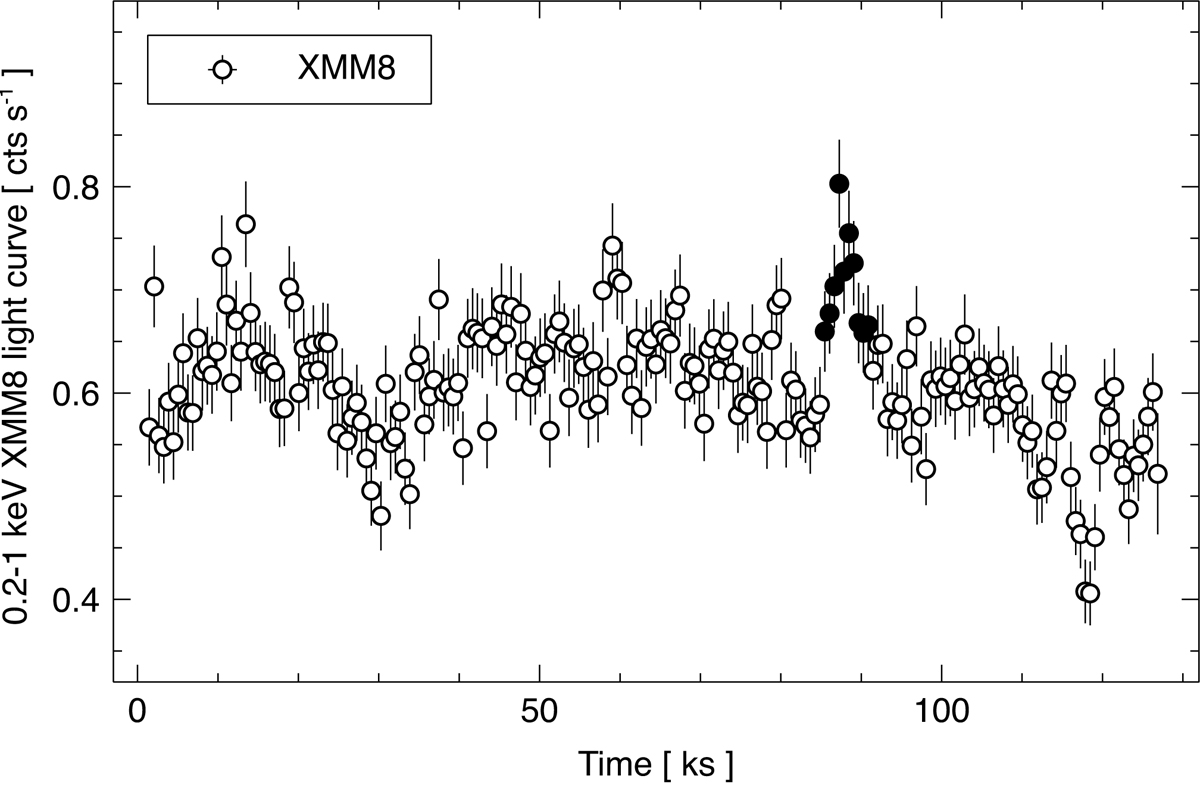
Fig. C.2.
Download original image
Best QPE candidate in QPE-less observations. We show the 0.2-1 keV light curve from the XMM8 observation. The most prominent flare, that is the best QPE candidate from all high-luminosity observations with no unambiguous QPEs, is highlighted. We used here a time bin of 600 s. The flare spectrum used to derived the quantities in Fig. C.1 (count rate and peak temperature) was extracted from a ∼1 ks time-interval around the peak. The empty circles define the period during which we accumulated the quiescent spectrum.
Current usage metrics show cumulative count of Article Views (full-text article views including HTML views, PDF and ePub downloads, according to the available data) and Abstracts Views on Vision4Press platform.
Data correspond to usage on the plateform after 2015. The current usage metrics is available 48-96 hours after online publication and is updated daily on week days.
Initial download of the metrics may take a while.