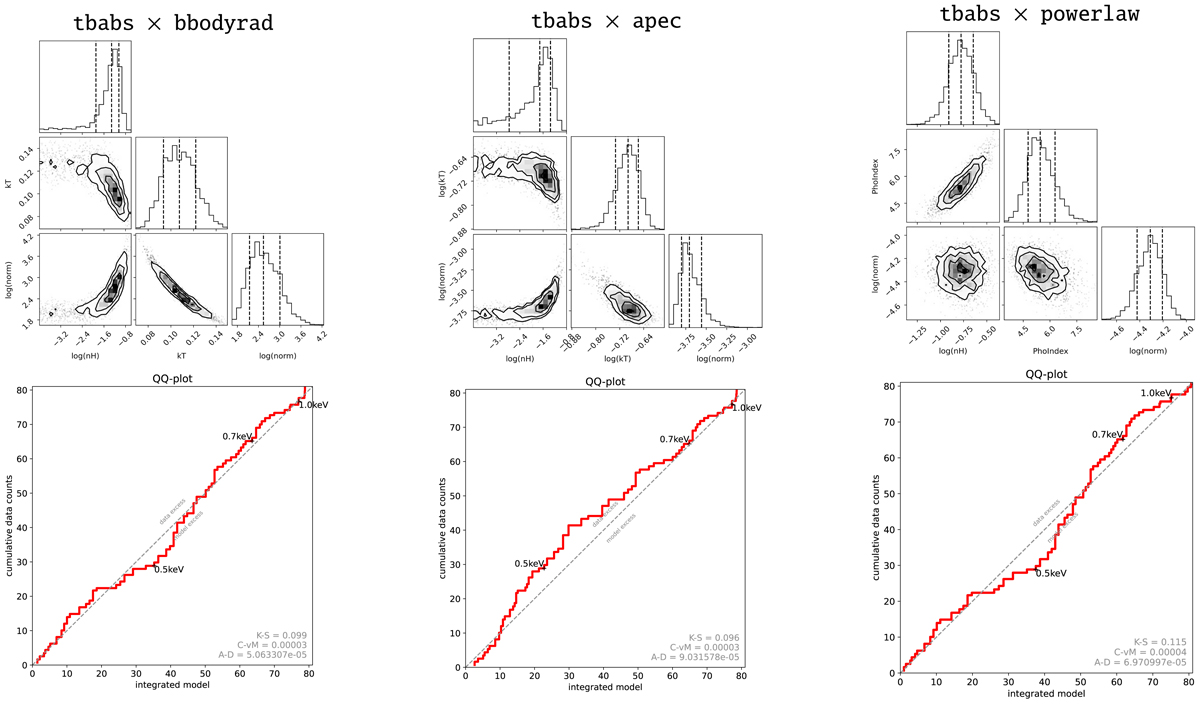
Fig. 4.
Download original image
Diagnostic diagrams presenting the best-fit results for J0657 for absorbed blackbody, apec, and power law spectra. For each of the three models, the top row depicts corner plots presenting the parameter distribution and correlations based on the inferred sample of test points from the fit. The vertical dashed lines indicate the 16%, median, and 84% percentiles. The lower row contains quantile–quantile plots, comparing the cumulative sum of counts derived from the best-fitting model in comparison to the observed spectrum.
Current usage metrics show cumulative count of Article Views (full-text article views including HTML views, PDF and ePub downloads, according to the available data) and Abstracts Views on Vision4Press platform.
Data correspond to usage on the plateform after 2015. The current usage metrics is available 48-96 hours after online publication and is updated daily on week days.
Initial download of the metrics may take a while.