Fig. 2.
Download original image
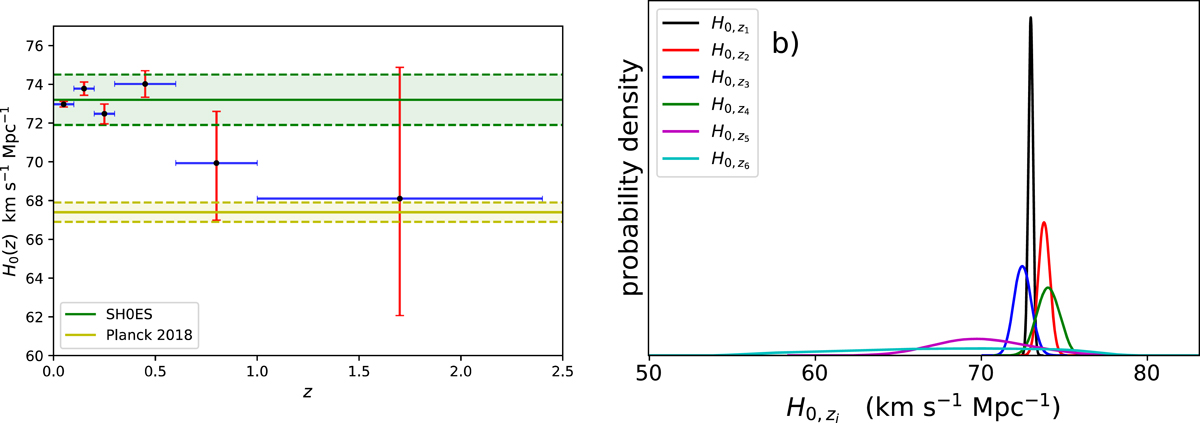
Fitting results of H0(z) in the Pantheon+ sample case for six redshift bins. The left panel shows the value of H0(z) as a function of redshift. There is a clear decreasing trend. The green line gives H0 = 73.04 ± 1.04 km s−1 Mpc−1 from local distance ladder and its 1σ uncertainty (Riess et al. 2022). The yellow line is the value of H0 = 67.4 ± 0.5 km s−1 Mpc−1 from CMB measurements and its 1σ uncertainty (Planck Collaboration VI 2020). The right panel shows the normalized probability distributions of H0, z in six redshift bins. These distributions are almost Gaussian.
Current usage metrics show cumulative count of Article Views (full-text article views including HTML views, PDF and ePub downloads, according to the available data) and Abstracts Views on Vision4Press platform.
Data correspond to usage on the plateform after 2015. The current usage metrics is available 48-96 hours after online publication and is updated daily on week days.
Initial download of the metrics may take a while.