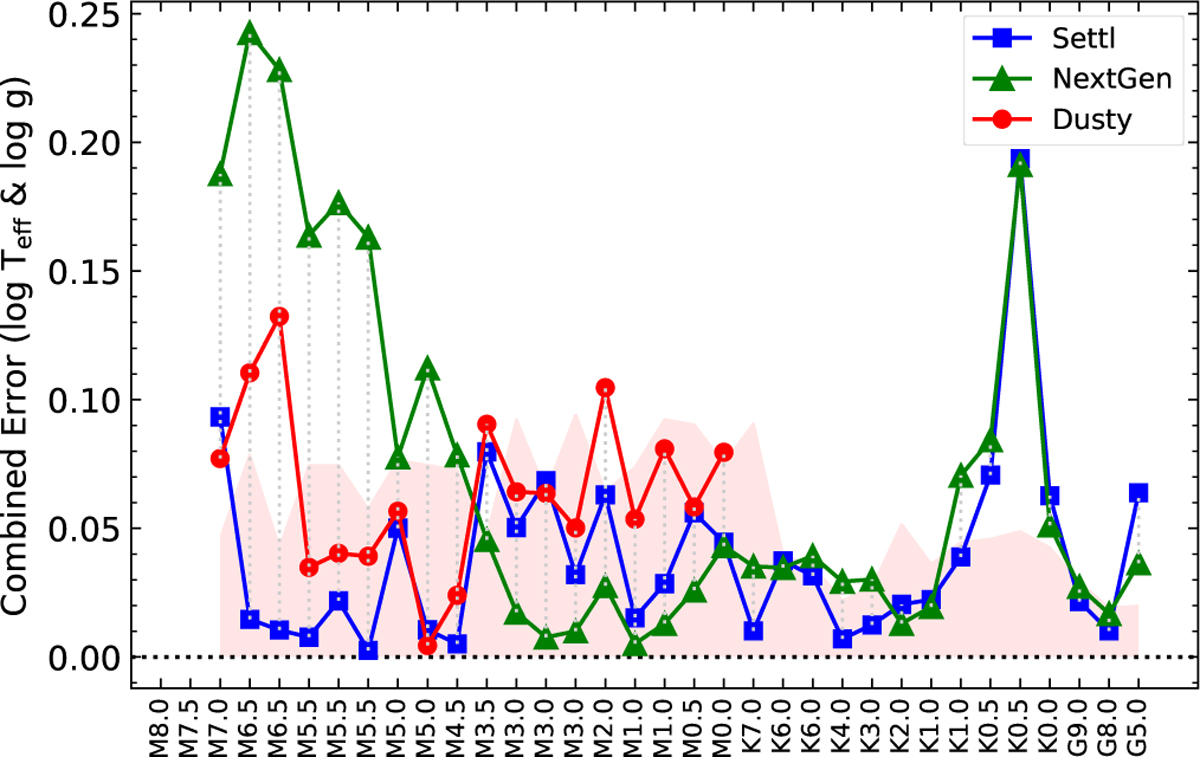
Fig. 4
Download original image
Average relative error of the template stars between the MAP estimates and the literature values sorted by their spectral type. The average error is calculated as the rms of the relative errors of temperature and gravity, both in log scale (Eq. (9)). The pink area indicates the ltr uncertainty of the literature value. We only present template stars whose literature temperature value is within the network training range and whose literature gravity value is presented. The colour codes are the same as in Fig. 3.
Current usage metrics show cumulative count of Article Views (full-text article views including HTML views, PDF and ePub downloads, according to the available data) and Abstracts Views on Vision4Press platform.
Data correspond to usage on the plateform after 2015. The current usage metrics is available 48-96 hours after online publication and is updated daily on week days.
Initial download of the metrics may take a while.