Open Access
Fig. 12
Download original image
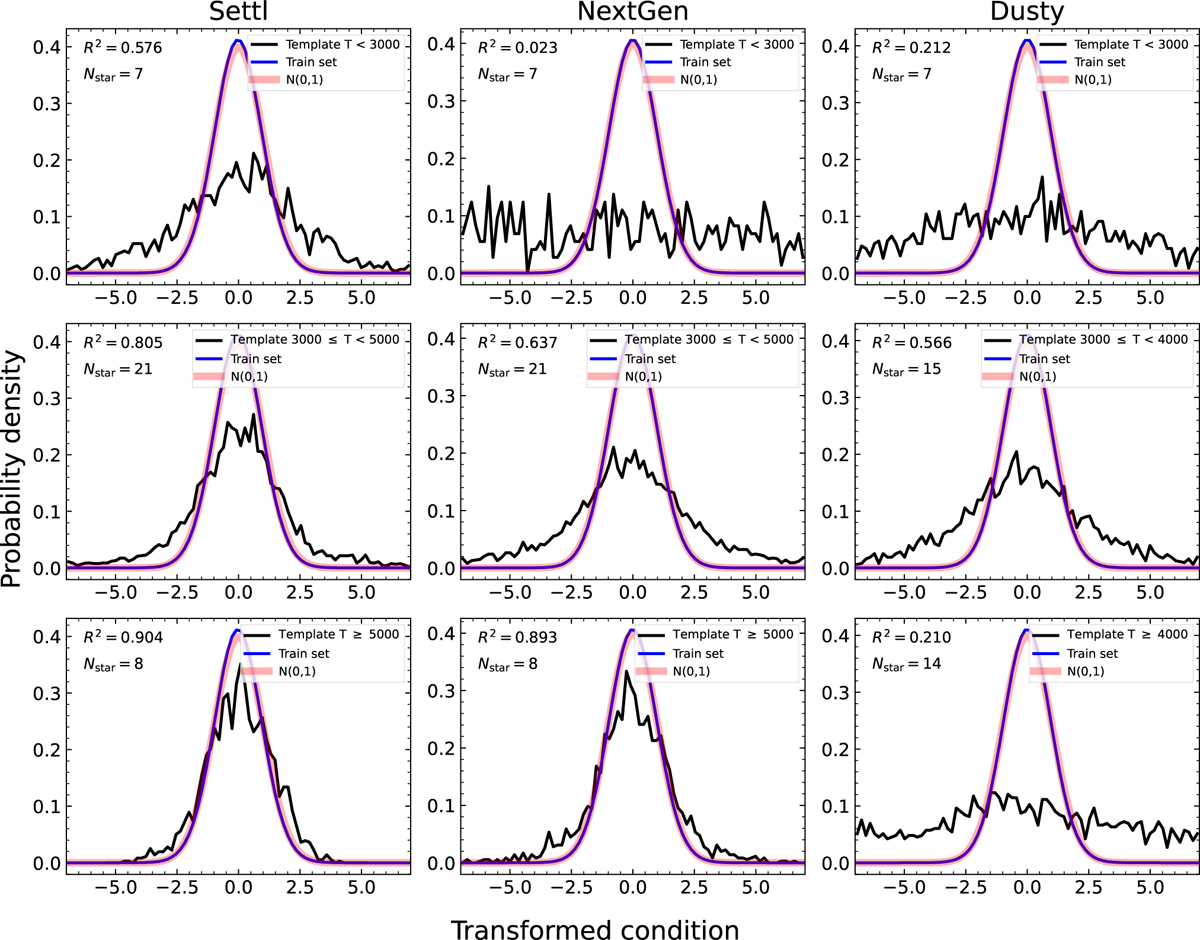
Probability distributions of transformed conditions of the training data and template stars. Each column represents three networks (Settl-Net, NextGen-Net, and Dusty-Net), and each row represents the group of template stars depending on their temperature ![]() . The colour codes are the same as in Fig. 11.
. The colour codes are the same as in Fig. 11.
Current usage metrics show cumulative count of Article Views (full-text article views including HTML views, PDF and ePub downloads, according to the available data) and Abstracts Views on Vision4Press platform.
Data correspond to usage on the plateform after 2015. The current usage metrics is available 48-96 hours after online publication and is updated daily on week days.
Initial download of the metrics may take a while.