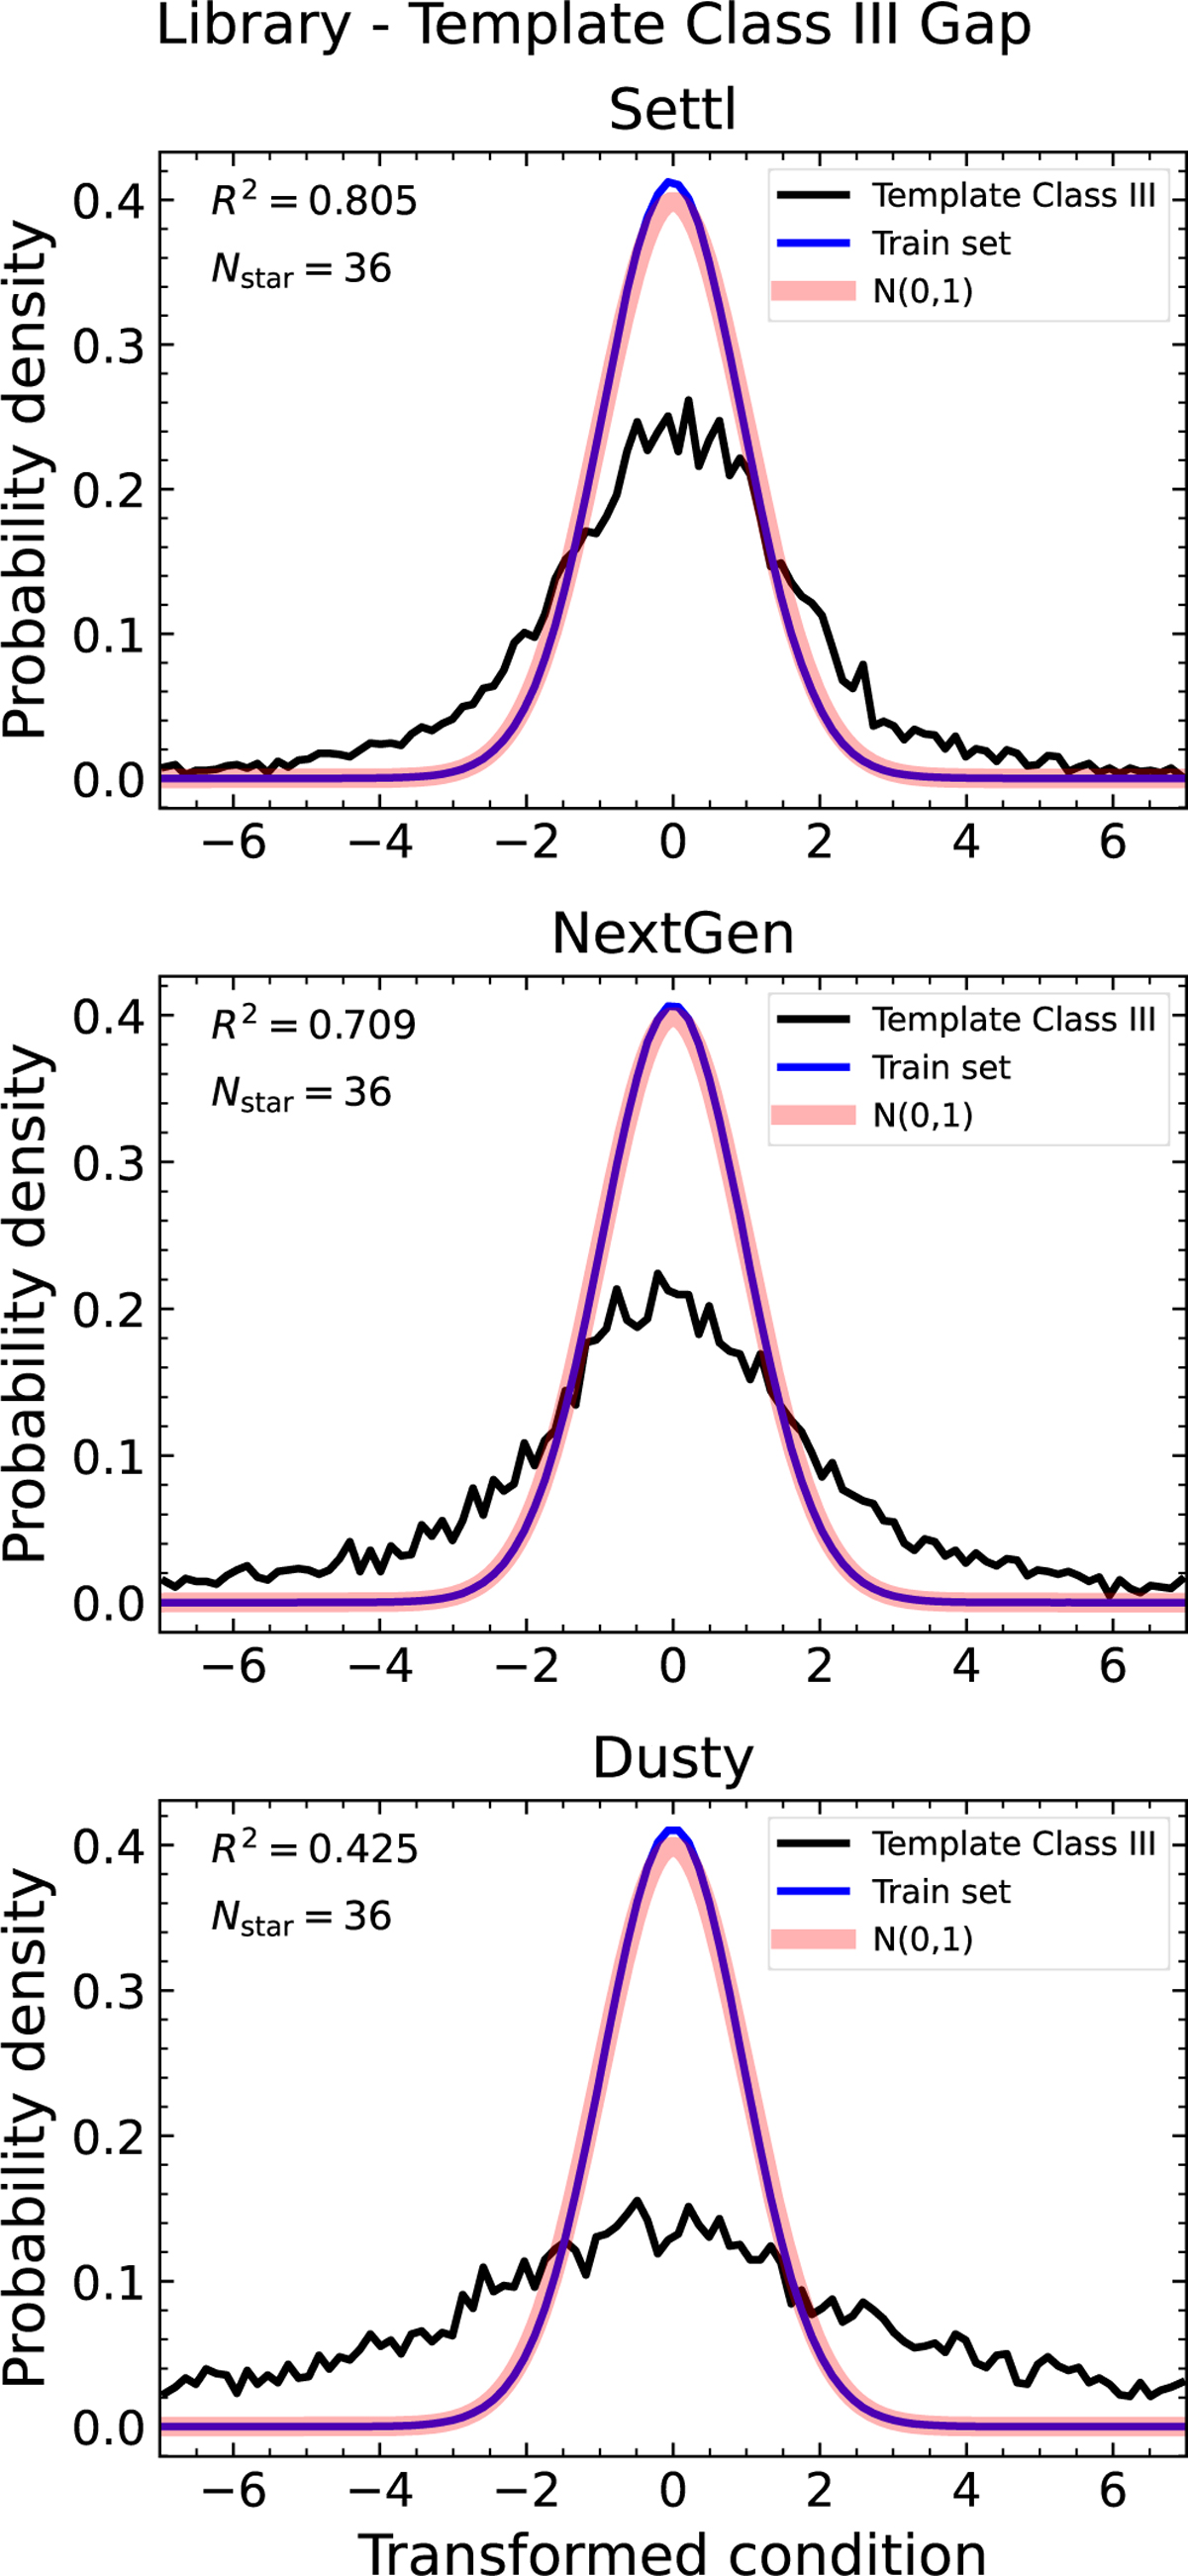
Fig. 11
Download original image
Probability distributions of transformed conditions of the training data (blue) and template stars (black) for three networks. The gap between the blue and black lines indicates the gap between the Phoenix model and the template spectrum. The R2 value between the blue and black line and the number of template stars used is presented in the upper left corner of each panel.
Current usage metrics show cumulative count of Article Views (full-text article views including HTML views, PDF and ePub downloads, according to the available data) and Abstracts Views on Vision4Press platform.
Data correspond to usage on the plateform after 2015. The current usage metrics is available 48-96 hours after online publication and is updated daily on week days.
Initial download of the metrics may take a while.