Fig. 3.
Download original image
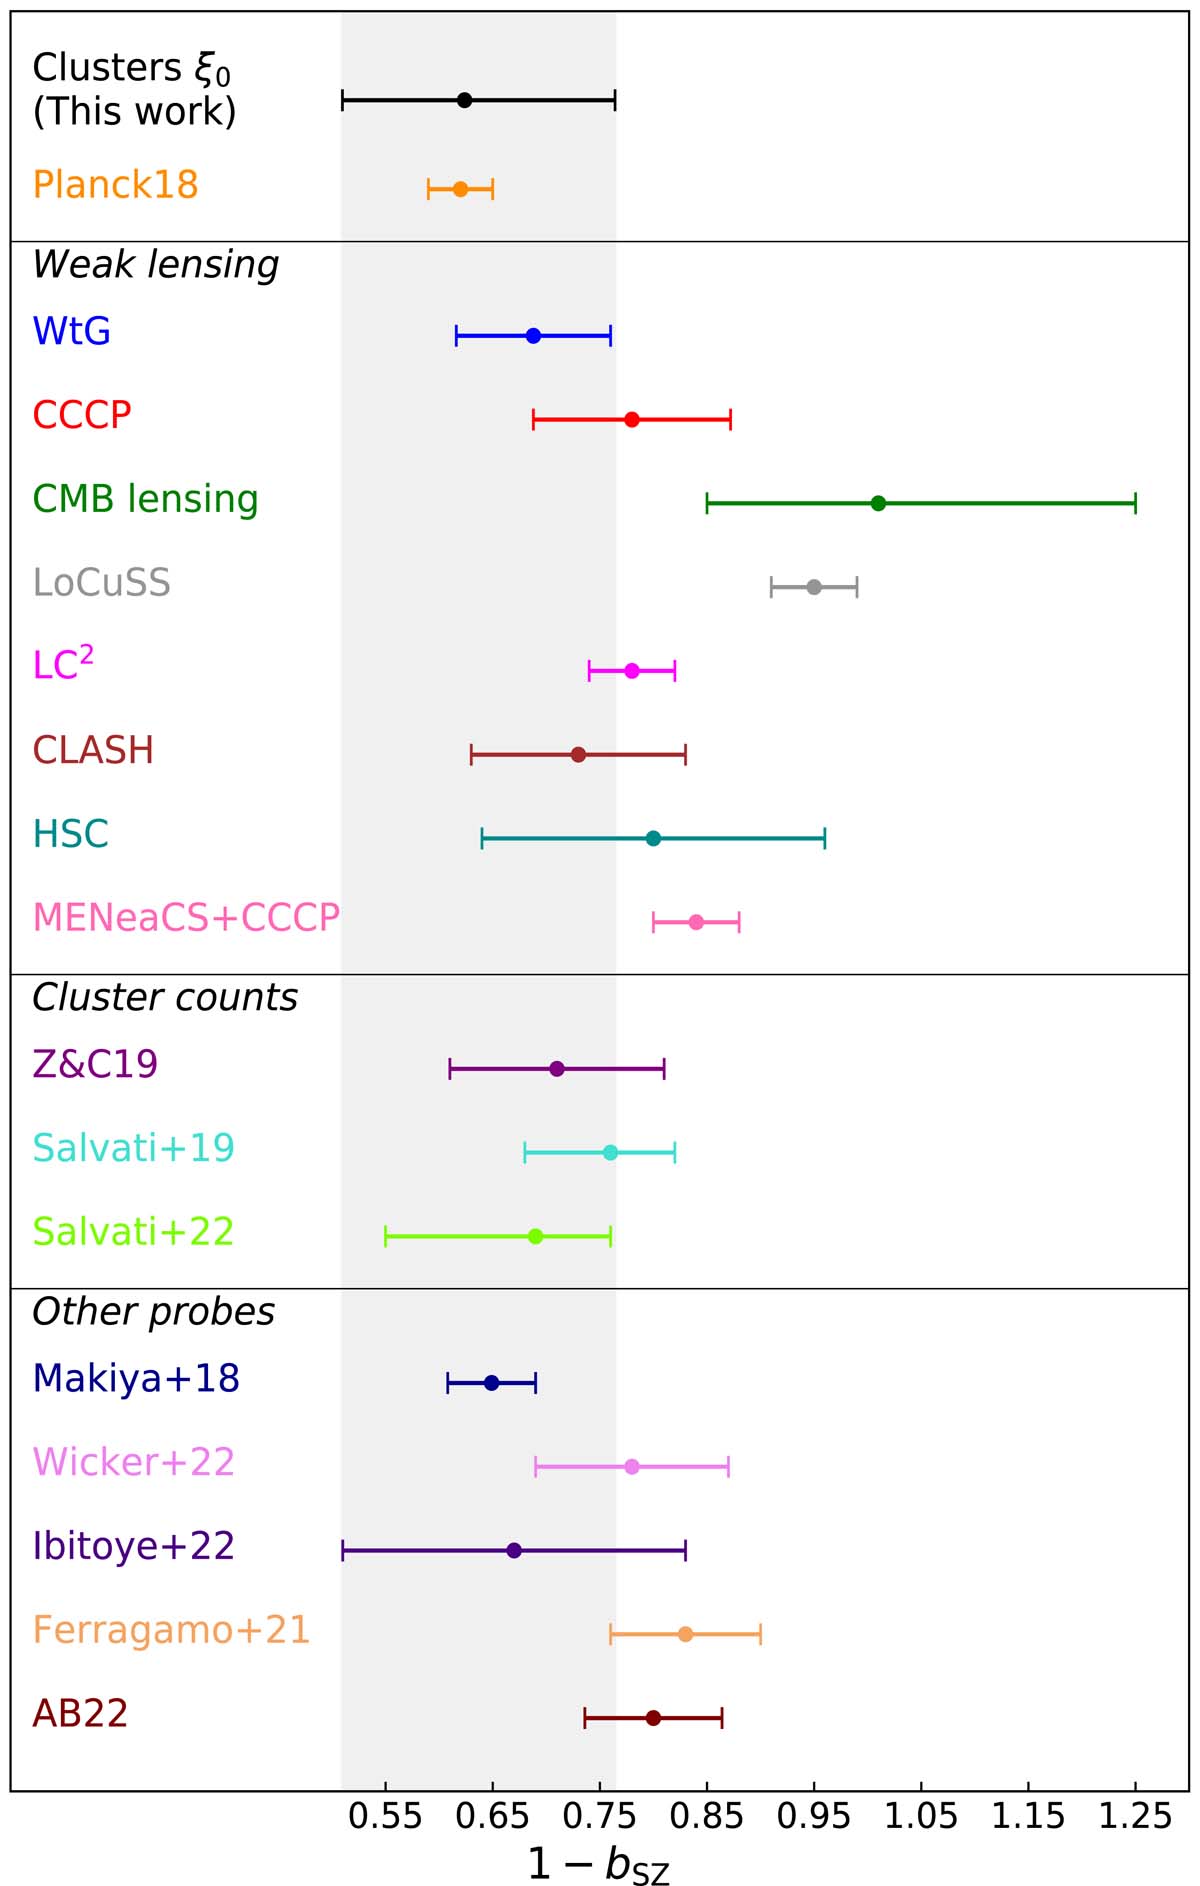
Comparison of the results on (1 − bSZ) with the literature. The median, 16th and 84th percentiles are shown. The black dot shows the constraint derived in this work. Then, in order from top to bottom, the following results are shown: Planck Collaboration VI (2020; orange), von der Linden et al. (2014; blue) Hoekstra et al. (2015; red), Planck Collaboration XXIV (2016; dark green), Smith et al. (2016; grey), Sereno & Ettori (2017; magenta), Penna-Lima et al. (2017; brown), Medezinski et al. (2018; cyan), Herbonnet et al. (2020; pink), Zubeldia & Challinor (2019; purple), Salvati et al. (2019; turquoise), Salvati et al. (2022; green), Makiya et al. (2018; dark blue), Wicker et al. (2022; violet), Ibitoye et al. (2022; indigo), Ferragamo et al. (2021; orange), and Aguado-Barahona et al. (2022; dark brown).
Current usage metrics show cumulative count of Article Views (full-text article views including HTML views, PDF and ePub downloads, according to the available data) and Abstracts Views on Vision4Press platform.
Data correspond to usage on the plateform after 2015. The current usage metrics is available 48-96 hours after online publication and is updated daily on week days.
Initial download of the metrics may take a while.